RETESTS ARE COMMON
Fifteen days ago we posted the following charts:
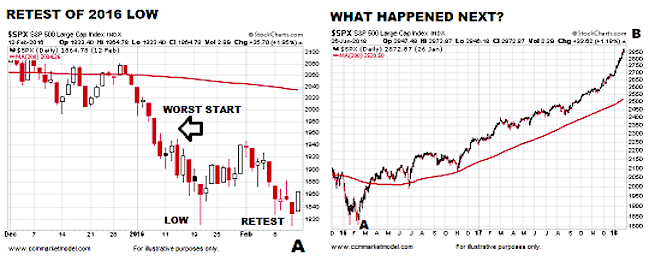
In that October 30 post we noted:
In the 2016 chart above, notice how it is not uncommon for the stock market to push higher and then backtrack to retest the prior low, something that may or may not happen in 2018.
If we fast forward fifteen days, the S&P 500 could be in the process of retesting the October 29 low of 2,603.
A retest of a low can take place by moving above previous low, to the previous low, or as noted earlier this week below the recent low. Retests can pass and retests can fail. We will learn something either way.
ANY SIMILARITIES TO 2016 LOW?
A logical question after five days dominated by selling conviction is:
Does the present day look anything like the days leading up to or the day of a low?
To help answer that question, we compared the S&P 500’s daily chart on the day of the major 2016 low to today’s chart. If we compare the strength of the move off the first low (compare A to B), you can make a case that numerous indicators looked stronger at point B then they did at point A. For example, in 2016 CCI never approached 100; in 2018 CCI recently cleared 100.
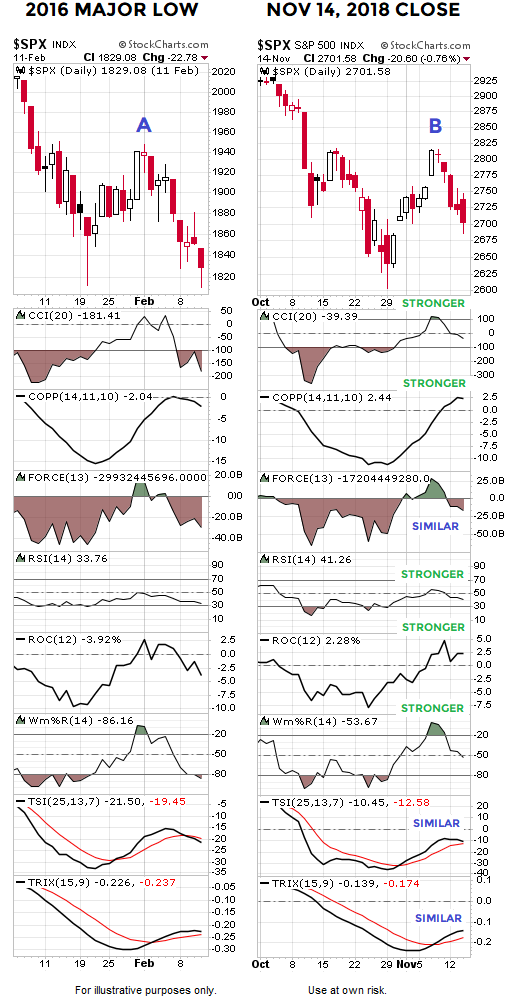
IMPORTANT: All we are looking for is similar here; we are not calling a low or forecasting a low in any shape, form, or fashion.
Like any other chart, indicator, or data point, if the look of the 2018 chart varies in a bearish manner in the coming days, then we will learn something. We are simply looking at the data in front of us today.
Tomorrow will bring new data and we will review it with an open mind. In the simplest terms, the charts above help us answer the question is there any reason at this time to remain open to a bullish reversal? We must also remain open to much lower lows.
PATIENCE CAN HELP AVOID A DEATH OF 1000 CUTS
When markets are indecisive, they can rally sharply for five days and then drop like a stone for five days. If we continually try to allocate to data that is flipping like a flapjack, we would most likely destroy value rather than add value.
Thus, we must seek a prudent balance between managing risk and managing the risk of overtrading, a concept that applies to mid-November 2018.
GUIDEPOSTS CAN HELP
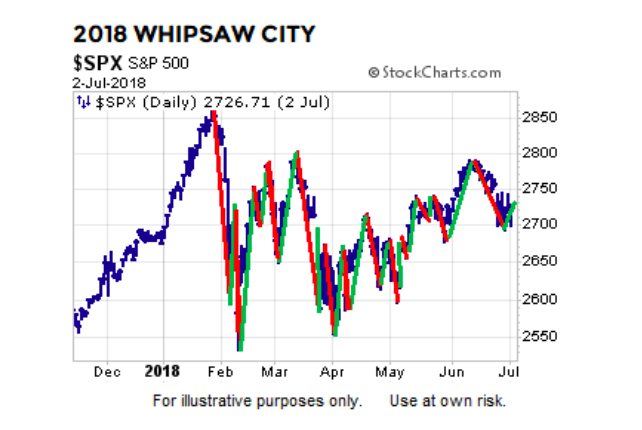
In the 2018 whipsaw chart above, using the February low of 2,532 as a “try to leave it alone” guidepost proved to be very helpful. There was nothing magical about 2,532, nor is there anything magical about any level, retracement, indicator, moving average, or form of possible support; they simply give us logical reference points to manage against.
continue reading on the next page…


