If a 2000-02 or 2007-08 event is still in front of us in 2018 (which may be the case), we know with 100% certainty all four of the levels shown below will be taken out and taken out in a convincing, decisive, and lasting manner.
Conversely, if stocks can make a stand soon (TBD), then all four levels will hold.
It is quite possible the real world falls somewhere in between, and as the 2011 low demonstrates, all four levels could be violated and the market could sharply reverse in a bullish manner – helping us emphasize there is nothing magical about any level or guidepost. Maximum flexibility 100% of the time even after levels are violated.
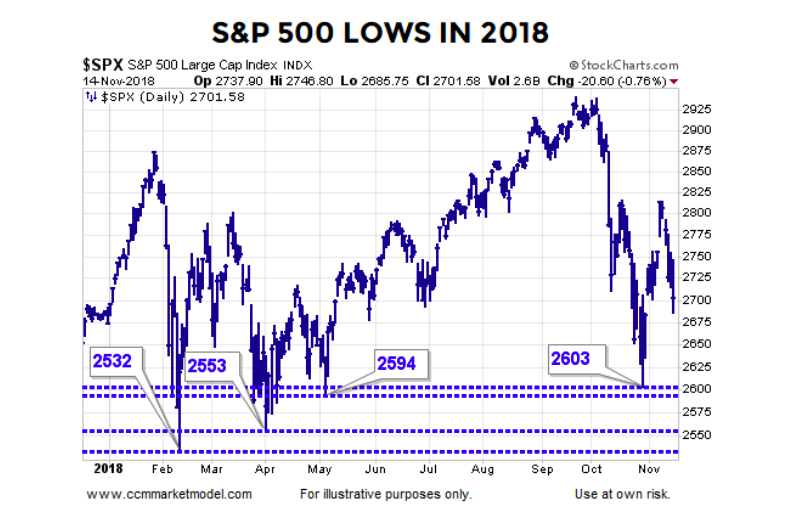
There is no question the four 2018 levels shown above acted as support. Thus, going forward they fall into the “areas of POSSIBLE support”. In each case, sharp and strong rallies occurred after the lows (see chart below). If we retest these areas, the retest may pass or it may fail. We learn something either way.
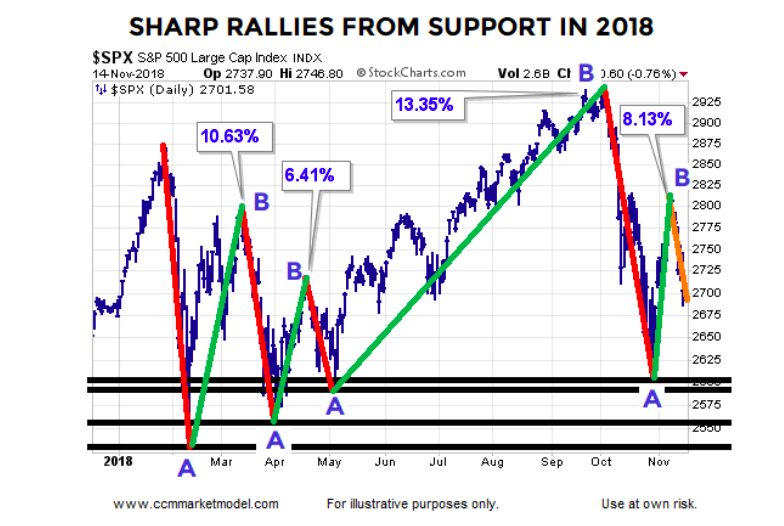
If the chart above was a 60-minute chart, we would not hesitate to consider the four levels as being possibly meaningful in the short run; fractals tell us the same concepts apply to a chart spanning an entire year. The percentages below show each A to B move after a low.
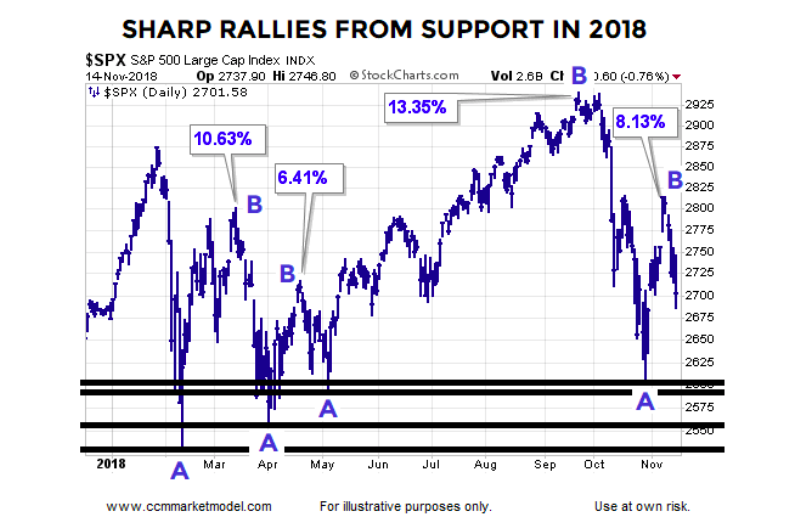
In all four cases prior to the bullish A to B move (green lines below), stocks dropped sharply (red lines below), it felt really bad, and it was stressful. In all four cases, sharp rallies (whipsaws) followed. Not a prediction about how things will turn out with the orange line; simply stating some facts about 2018 YTD.
BULLISH TRENDS AND BEARISH TRENDS
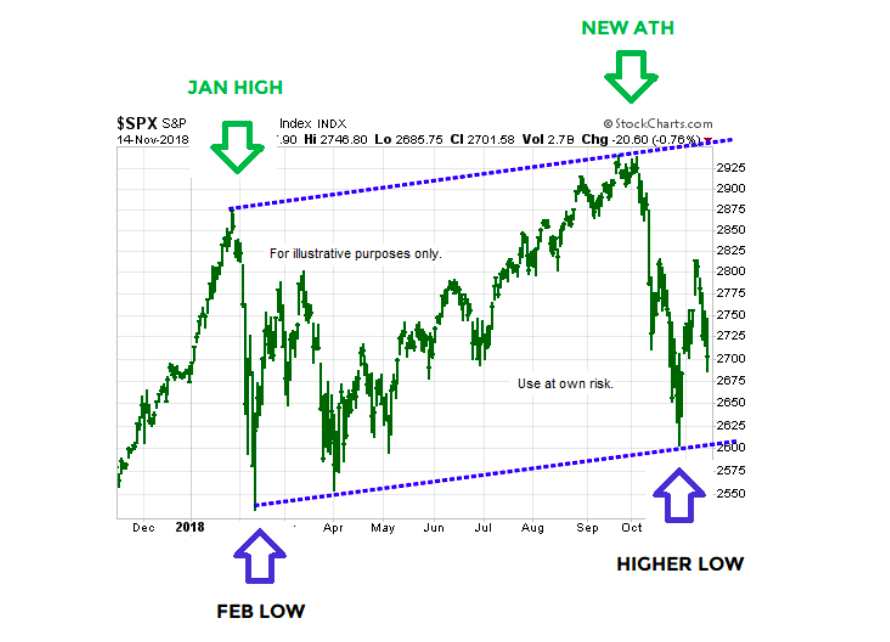
When the data is mixed, it can be helpful to look at things in the simplest terms possible. Bullish trends make a series of higher highs and higher lows. Bearish trends make a series of lower highs and lower lows. The last major event in the S&P 500 was a new all-time high that was made 54 calendar days ago. Thus far, the low in the current decline represents a higher low relative to the February 2018 low. If a devastating bear market lies ahead (which may be the case), we know with 100% certainty the S&P 500 will make a significant lower low below the February 2018 low (requires a drop of more than 169 points from 11/14/2018 close). That may indeed happen in short order, but it has not happened yet.
BEARISH OUTCOMES AND MUCH LOWER LOWS
Are there reasons to be concerned and could much lower lows be in the cards? Yes on both counts. What happens if we take out all four 2018 lows? Obviously, that would most likely prompt some defensive shifts (add to cash and/or add defensive assets); it depends on how the data looks at that time. The shifts could be relatively minor or they could be significant. Our approach is built on taking it day by day based on the facts in hand. If action needs to be taken based on the facts, action will be taken.
We still have two full trading days before this week goes into the history books. A typical retest of a low says even under the successful retest scenario, the S&P 500 may still need to drop another 60 to 120 points. If we look at multiple timeframes (5 min to weekly), three additional S&P 500 levels are worth noting: 2,691, 2,687, and 2,646. Those levels range between 10 and 55 points below Wednesday’s close.
ADDITIONAL FORMS OF POSSIBLE SUPPORT
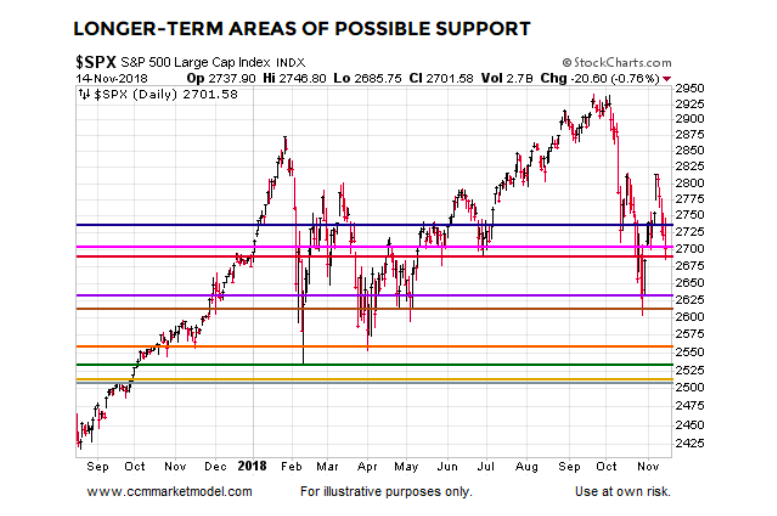
The chart below was originally presented to assist with “what happens if all three A to B retracements are taken out?” Many of the levels shown are based on longer-term retracements dating back to the February 2016 major low. The chart below is as of the close on November 14, 2018.
DATA ON DECK – ADDITIONAL COMMENTS
Retail sales are due to be released Thursday and the latest industrial production numbers come Friday before the markets open. Additional charts and comments can be found here.
Twitter: @CiovaccoCapital
The author or his clients may hold positions in mentioned securities at the time of publication. Any opinions expressed herein are solely those of the author, and do not in any way represent the views or opinions of any other person or entity.


