From a positioning perspective, investors have historically elevated, although not extreme, levels of equity exposure. History suggests a strong inverse relationship between equity exposure and forward equity returns. While not a short-term timing mechanism, it does suggest that equities overall are a crowded trade. The historically under-owned asset class is cash.
Seasonal patterns offer a mixed message for the second half of 2017. When looking at the cycle composite for the S&P 500 (which aggregates the 1-year, 4-year, and 10-year cycles), the path of least resistance could push higher into the summer months but then get more challenging heading into year-end. While this describes what has happened in the past, this time (as is every time) is necessarily different. No two experiences are the same, so we would not want to rely on this roadmap without confirmation from the breadth and trend indicators.
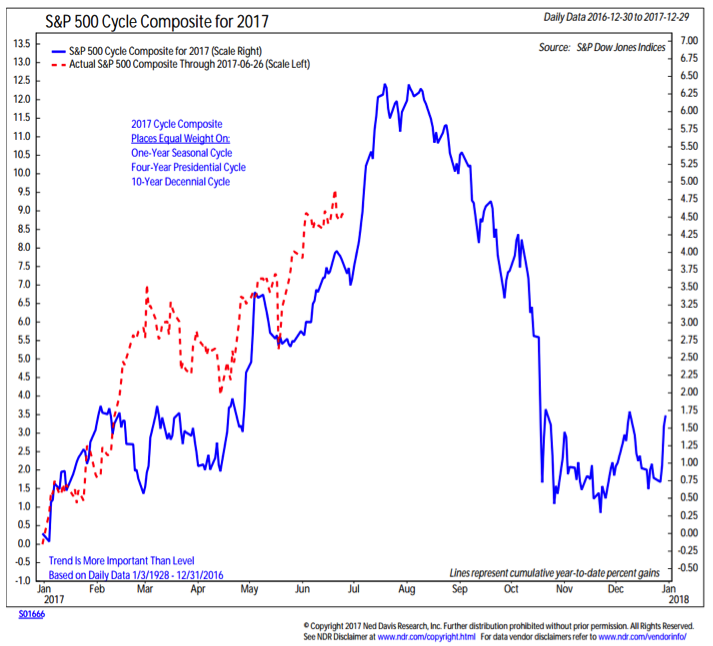
Not only do we not see confirmation from the current breadth and trend indicators, but the seasonal patterns are not in full agreement for the second half of the year. As we mentioned before, the lack of significant weakness in the first half of 2017 argues for above-average strength in the second half. From a global perspective, the four-year trend remains a tailwind for stocks until the second quarter of 2018 (when domestic attention will likely turn to mid-term elections). For now we are keeping seasonals rated neutral, but fully expect the second half of 2017 to feature more volatility than was seen in the first half (it could hardly experience less, it would seem).
Not only do we not see confirmation from the current breadth and trend indicators, but the seasonal patterns are not in full agreement for the second half of the year. As we mentioned before, the lack of significant weakness in the first half of 2017 argues for above-average strength in the second half. From a global perspective, the four-year trend remains a tailwind for stocks until the second quarter of 2018 (when domestic attention will likely turn to mid-term elections). For now we are keeping seasonals rated neutral, but fully expect the second half of 2017 to feature more volatility than was seen in the first half (it could hardly experience less, it would seem).
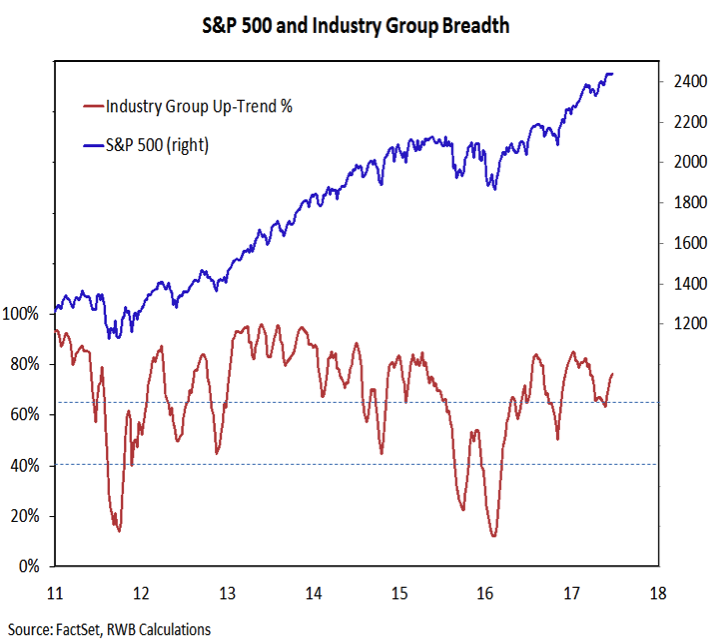
Broad participation is not just a domestic theme. Most markets around the globe have been in rally mode in 2017. This is the mark of a strong bull market. Currently better than 85% of the markets that make up the All Country World Index (ACWI) are above their 200-day averages. The bottom line here is that strength in the S&P 500 has been and continues to be supported by broad support within the index and around the world.
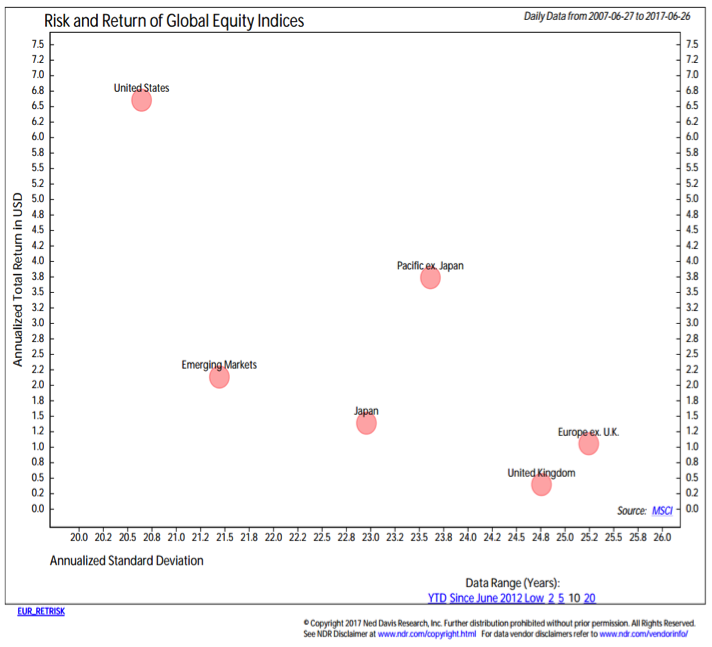
Normalization is not just a monetary policy phenomenon in 2017. Following an extended period in which asset allocation through diversification has not provided expected benefits, 2017 has started to see a return to a more normal trade-off between risk and return and the benefits to a globally diversified portfolio. For U.S. investors the past few years have been a case where staying at home in terms of investments provided the best risk/return trade-off and diversifying overseas reduced returns and increase portfolio volatility. The emergence of more normal asset allocation environment in 2017 is a healthy development that is expected to continue.
We have also seen a continued decline in correlations between S&P 500 stocks and the index itself. The correlation peaked in the wake of the financial crisis as stocks were in a risk-on/risk-off mode. Correlations briefly rose again in 2015 as the S&P 500 went through a cyclical bear market. In 2017 the correlation between stocks and the index has dropped below its long-term average for the first time since prior to the 2008-2009 bear market. The takeaway from this is that more so than in recent years, investors are able to consider a market of stocks (and sectors) rather than just a stock market. This means relative opportunities within the market may be more pronounced in recent years. At a time when the focus is increasingly on passive investing, it may be beneficial to consider some actively tactical tilts toward leading sectors.
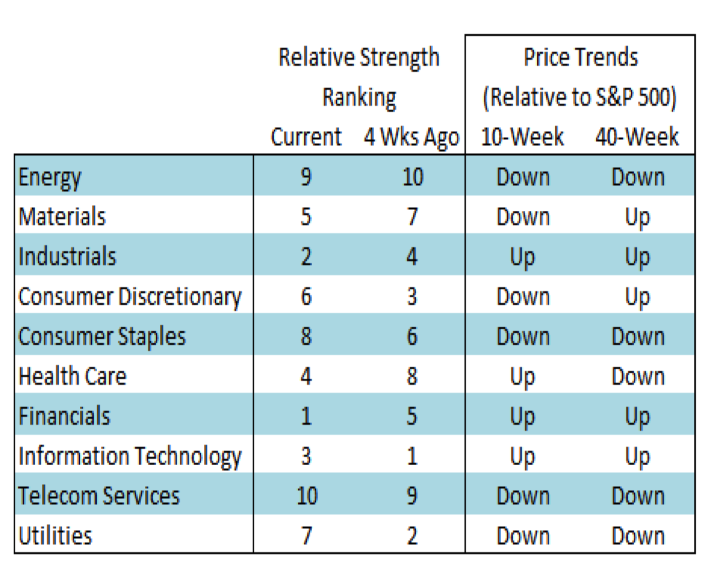
Sector leadership trends are captured by our relative strength rankings. Not only does this help identify leading sectors to tilt toward, but it also helps identify relative laggards that should be avoided (or underweighted). At mid-year, leadership rests with Information Technology, Health Care, Industrials, and Financials. Within this group, Information Technology looks the most extended and may be set to see a decline in ranking over the course of the second half. Industrials have been solid for some time, while Financials and Health Care have begun to strengthen more recently. The most pronounced weakness is coming from Energy and Telecom Services.
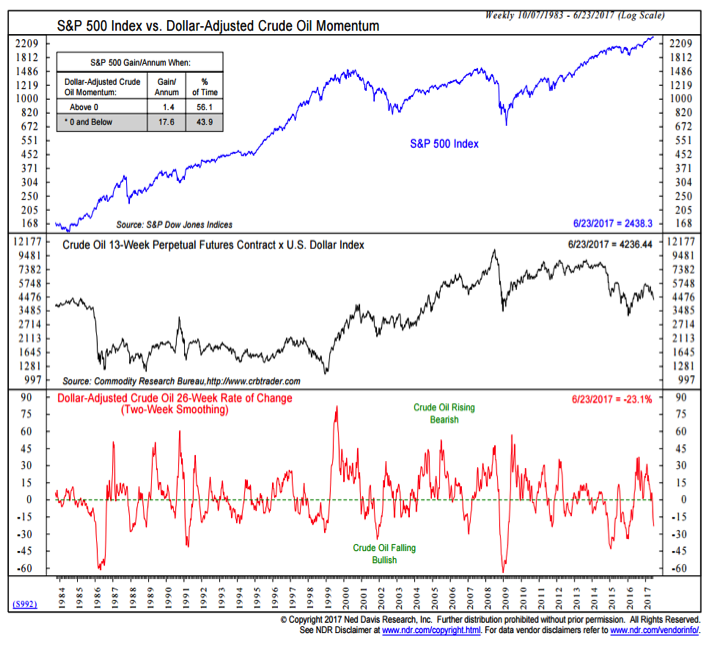
Consistent with, and contributing to, weakness in the Energy sector has been the collapse in the price of oil, particularly when considered on a dollar-adjusted basis. Importantly, weakness in oil does not appear to be a signal to expect broader weakness. In fact, crude oil falling is bullish for stocks overall. So while the second half of 2017 may see an increase in the muted volatility experienced in the first half, the decline in the price of oil is not likely to be the culprit.
Thanks for reading.
Twitter: @WillieDelwiche
Any opinions expressed herein are solely those of the author, and do not in any way represent the views or opinions of any other person or entity.

: Showing Some Signs of Emerging Strength")
