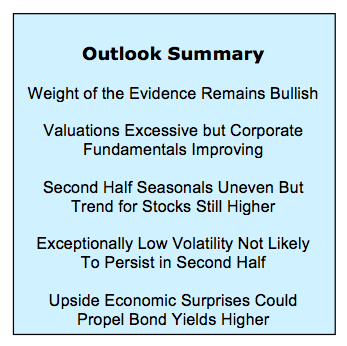
2017 Investing Highlights & Market Insights:
- Stocks Move Higher as Noisy Calm Persists
- Fed Sticks to Normalization Plans
- Economy Could Finally Exceed Reduced Expectations
- Despite Focus on Narrow Leadership, Market Breadth Strong
- Global Rally Providing Diversification Benefits
Surprises dominated the first half of 2017, and there is little reason to think that the second half will be much different.
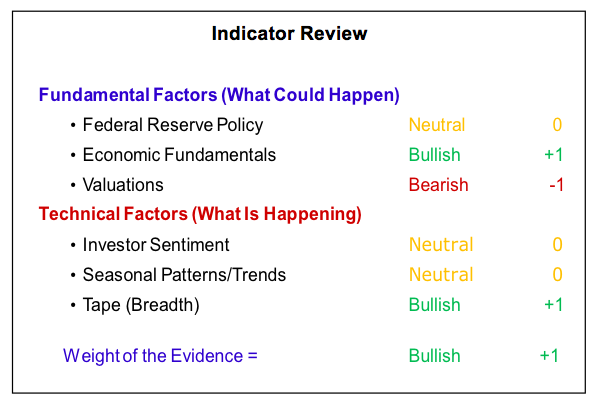
That is not to say that the next six months will be a carbon copy of the previous six months. Rather, it is an encouragement for investors to keep an open mind and not get locked into believing only those things which confirm a pre-existing narrative. This stresses the importance of developing a view in light of what could happen, but tempering that against an ongoing assessment of what actually is happening. Through the unlikely combination of noisy calm that dominated much of the first half of the year, the weight of the evidence remained tilted toward a bullish message, and this message is intact as we look toward the second half.
Despite some data disappointments in the first half, underlying economic fundamentals (including low inflation) remain bullish for stocks, and the stock continues to benefit from a bullish tape and broad rally participation. Valuations remain bearish and speak to elevated risk in the current environment. The other factors are neutral right now.
Looking ahead, we are thinking about the second half of 2017 through the lens of three primary considerations: the ongoing impact of continued tightening by the Fed, the outlook for economic growth in the second half after a generally disappointing first half (particularly in the U.S.), and how well the stock market is able absorb the emerging leadership rotation.
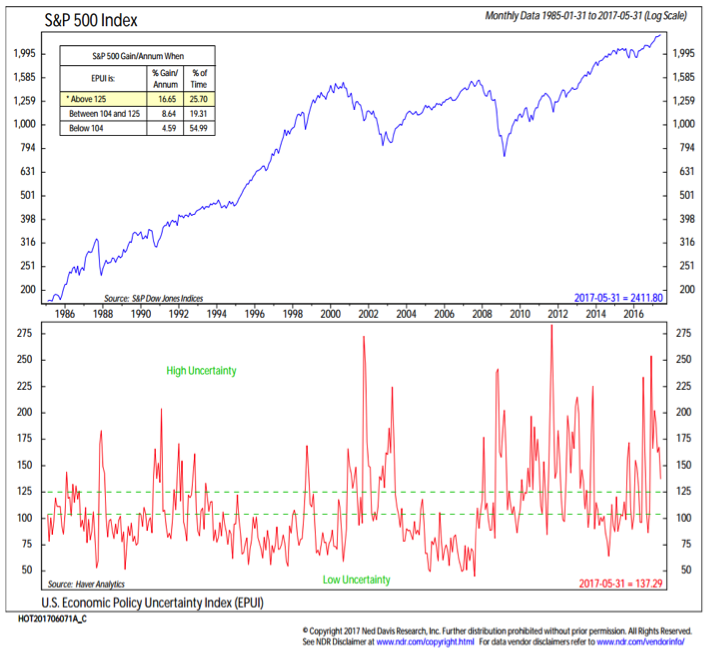
Despite the uncertainty in the political environment, there are indications that a more normal macro investing environment may be emerging. That could very well include an uptick in volatility in the second half even if the underlying trends remain intact Whether it was overseas elections, the timing of domestic policy initiatives, or the scope of central bank actions, the macro backdrop received plenty of attention in the first half of 2017. In a social media context, much of this discussion could have been tagged #uncertainty. While policy uncertainty is a headwind for economic growth, it actually served as a bullish influence on the stock market, offsetting investor sentiment measures that were at times tilted toward excessive optimism. The uncertainty index has moved lower as partisanship has remained elevated and legislative proposals have stalled. The caveat for the second half may be that with expectations for the economy and reforms out of Washington DC at a low ebb, the opportunity for an upside surprise has re-emerged.
For all the noise around uncertainty, the news from the first half of 2017 was actually the remarkable lack of volatility. Heading into mid-year, the S&P 500 has not seen a 5% pullback in 250 days, the longest such streak since the mid-90s. The largest peak-to-trough pullback on the S&P 500 in the first half was a 2.8% decline over the course of March and April. This is the second smallest such pullback in history (only the 1.7% drawdown in the first half of 1995 was smaller). In previous instances when the first half of the year saw peak-to-trough declines of 5% or less, stocks saw above-average strength in the second half. While stocks are overdue for a 5% correction, such a pullback could help provide a strong base for the next sustained move higher.
One of the remarkable developments in the first half was the ability for stocks to not see a meaningful pullback even as economic data was consistently underperforming expectations. The relationship between stocks and the economic surprises indexes is not always one-for-one but for stocks to stay strong in the face of a sharp deterioration in economic data (relative to expectations) was a pleasant surprise in the first half of the year. It is also worth noting that looking across these indexes, other economies fared better than the U.S. economy relative to expectations. The good news is that expectations seem to have been reset. This provides a lower hurdle to get over in the second half, and we could again see upside surprises from the economy. This, in addition to continued tightening by the Fed could put upward pressure on bond yields over the course of the second half.
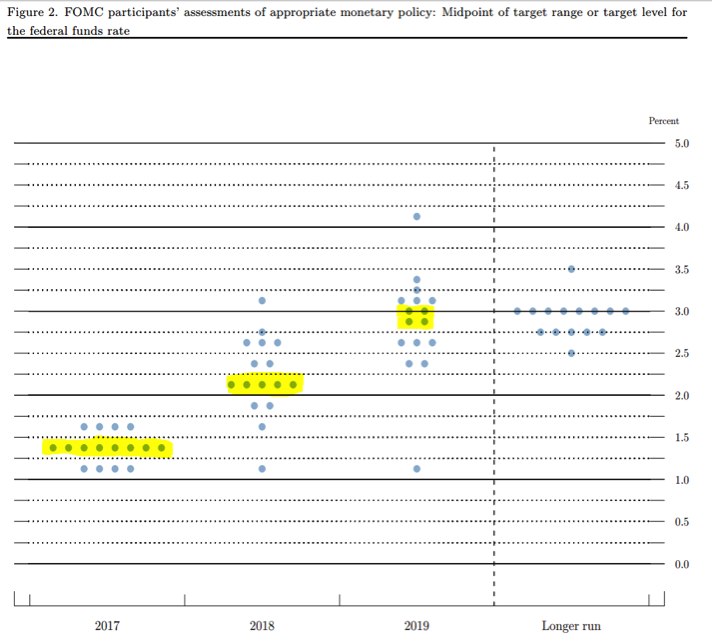
The Fed has already raised the fed funds rate by 50 basis points in 2017. According to the dot plot published by the Fed, the median expectation among FOMC participants is for one more 25 basis point rate hike this year, and a continued gradual path of policy normalization over the next two years. We do not see this as a precise forecast of where rates are heading, but rather an expression of the Fed’s desire to continue to normalize monetary policy. In the second half of 2017 this may also mean starting to draw down the Fed’s balance sheet. So far, the Fed has done a great job of telegraphing its intentions and guiding market expectations. While rates are moving higher, the deliberate pace of normalization has kept this from being a headwind for stocks.
Even as the Fed has been raising interest rates, it has been hard to argue that it has been tightening monetary policy. Labeling it “normalization” is not just a question of semantics but reflects the still low absolute level of interest rates (the 3-month T-bill yield in June rose above 1% for the first time since 2008) and while plans for its draw down have been laid out, the Fed’s balance sheet continues to show more than $4 trillion in assets. Beyond this, the national financial conditions index, published weekly by the Chicago Fed, suggests that financial conditions remain loose and, in fact, are looser than they were when the Fed began raising rates in December 2015.
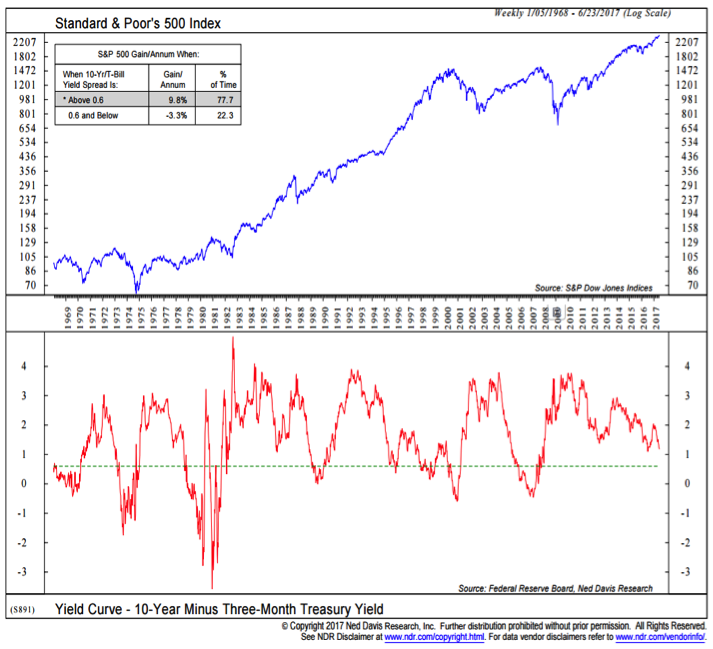
Short term bond yields have been rising as the Fed has raised the Fed funds rate, but longer-term bond yields have not. In fact, since the December 2016 rate hike, the 3-month T-bill yield has risen by 50 basis points, while the 10-year T-Note yield has fallen by 25 basis points. This means the yield curve (measured here by the spread between the 10-year T-Note yield and 3-month T-Bill yield) has fallen 75 basis points over the past six months, and it is now approaching its lowest level since just ahead of the financial crisis. This has attracted attention, and the flattening of the yield curve is viewed by some as an ominous indicator for the stock market and the economy. While it bears watching, we do not yet see this as a harbinger of weakness. A spread of less than 0.6% between the T-Note and T-Bill would warrant a reassessment of this in our view.
The yearly change in the T-Bill yield, however, is getting close to a bearish signal for stocks. Stocks have historically struggled to make headway when the T-bill yield has risen by more than 74 basis points (that would be three 25-basis point rate hikes).
continue reading on the next page…

: Showing Some Signs of Emerging Strength")
