If the Fed’s next rate hike is in September, that could turn this indicator bearish on stocks. If, however, the Fed spends the third quarter implementing its balance sheet reduction plan and waits until the December FOMC meeting to raise the fed funds rate again this indicator could remain in neutral.
In other words, continuing to normalize policy at a gradual rate could keep the Fed at neutral with respect to the stock market but accelerating its pace of rate hikes could turn it bearish for stocks.
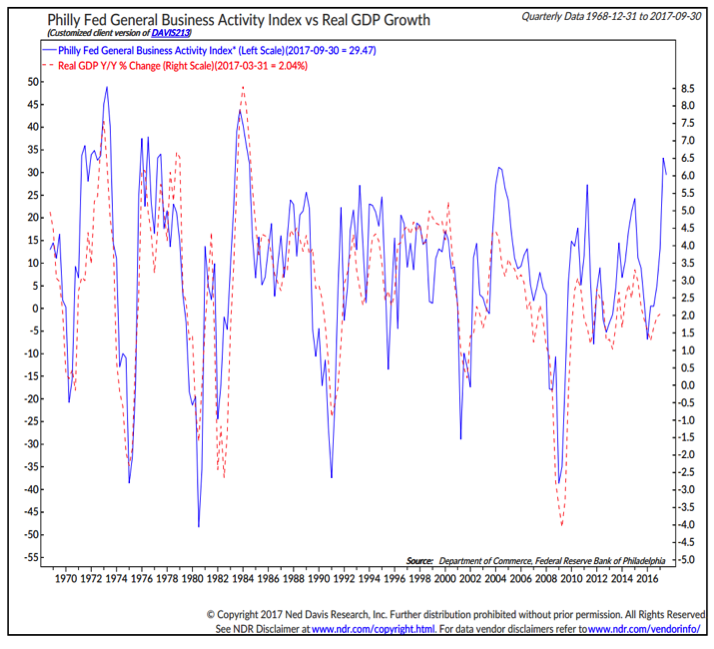
The Fed is not acting in a vacuum. It can consider the actions of other central banks (which are also talking of beginning to normalize policy) but more importantly the Fed needs to consider the underlying health of the U.S. economy. As we mentioned above, data for the first half was generally disappointing. This did not dissuade the Fed from pursuing its plans. But economic growth will likely have to improve in the second half if the Fed is going to stay true to its announced intentions/expectations. Looking at the recent readings from the Philadelphia Fed’s Business Activity Index, a rebound in GDP growth in the second half does not seem out of the question.
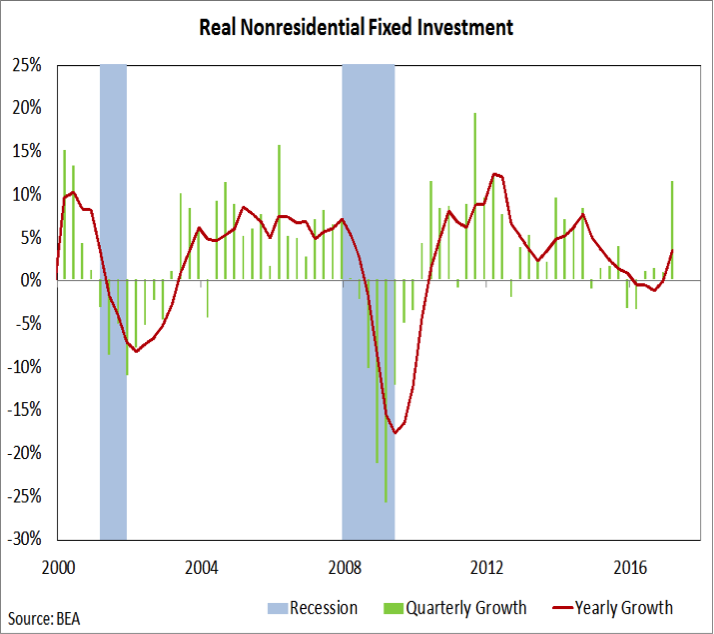
While economic data has been generally disappointing in the first half of 2017, there have been clear pockets of strength. The aforementioned Philly Fed index, as well as other monthly business surveys, has showed that activity has been relatively robust. One of the most hopeful developments was the surge in non-residential fixed investment spending in the first quarter. The 11% surge in spending was the best quarterly increase since 2012 and suggests that increased optimism among CEOs and CFOs is translating into activity. A continued manifestation of these animal spirits could be a spring board that provides an improved growth trajectory for the U.S. economy going forward. The recent lack of productivity growth is related in part to lack of capital deepening represented by a lack of investment spending. That may now be changing.
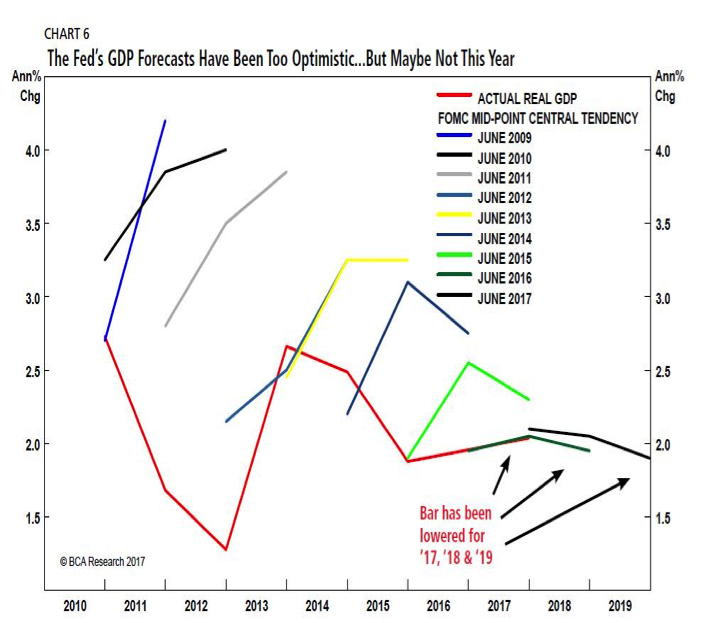
Disappointing growth is not new to 2017 – it has been a feature of this recovery from the beginning. Over time, however, forecasts for growth have been moving lower, as represented in this chart from the Bank Credit Analyst. The Fed’s forecasts for growth for this year and the next to now assume no acceleration from the current pace. With forecasts having caught down to reality, the opportunity for a meaningful upside surprise becomes more significant. This is not just the normal fluctuations in the economic surprise indexes, but would represent a paradigm shift away from the experience of the past 15+ years (during which growth forecasts were often wrong and always too optimistic).
The table seems to be set to finally provide an upside surprise. While data is seasonally adjusted, there have been questions about residual seasonality still appearing in first quarter growth data (which suggests that the 1.2% growth seen in the first quarter of 2017 may understate the actual level of growth). Moreover, in five of the past seven years, growth in the second half of the year has been stronger than in the first half. If growth for the first half overall comes in near 2.0%, an even modest acceleration in the second half, which would be consistent with recent experience, could push growth for 2017 overall above the Fed’s forecast.
Growth trends have improved around the world – and that provides strength to the recovery being seen in the U.S. Nearly 90% of economies around the world are showing positive and accelerating growth, as measured by country-level Purchasing Managers’ Indexes. Until it faltered in April, world trade volume had been echoing this improvement, with the yearly growth in trade volume having reached its best level since 2011. The April decline was large, but it remains too early to draw a strong conclusion as to whether this was part of the normal month-to-month volatility in this series, or the beginning of a more meaningful moderation in trade activity. The second half of 2017 may tell that tale.
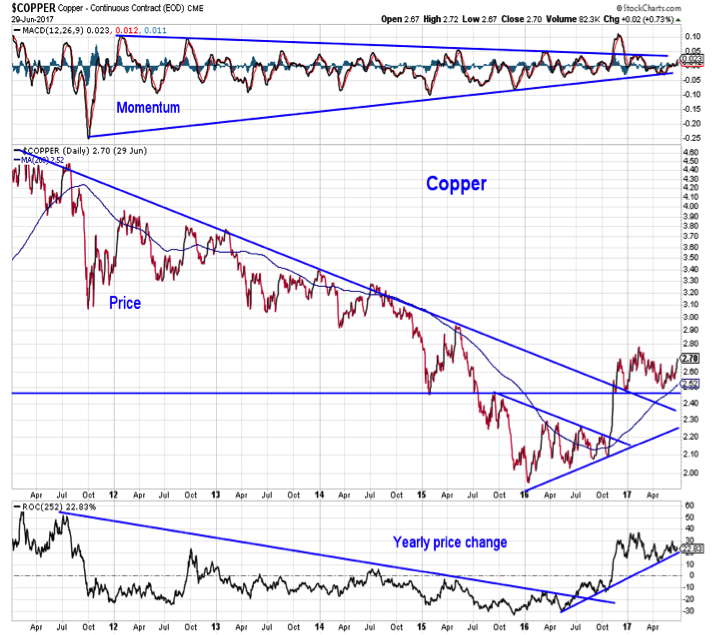
Another arrow in the quiver arguing for better growth trends going forward has been the relative stability in copper after breaking a multi-year downtrend last year. While copper has not made much overall headway in 2017, it has not broken down either. In fact momentum still argues for a resumption of strength following this period of consolidation. Copper prices tend to reflect industrial activity and the stability seen in the first half of 2017 suggests that the underlying economic trend remains positive.
While the Fed is not yet a headwind, and economic trends remain supportive, this is not a low-risk environment for stocks. Valuations have expanded in recent years as price recovery has moved ahead of stock market fundamentals. Valuations are a poor timing indicator but over time do a good job of measuring risk. While just one valuation measure is shown (the median price/earnings ratio for the S&P 500), the overwhelmingly consistent message across valuation measures is that stocks are expensive relative to a variety of corporate and economic fundamentals.
The good news from a fundamental perspective is corporate sales and earnings growth has rebounded. The first quarter saw the best sales and earnings growth since 2011. Even with expectations relatively high, the percentage of companies with positive earnings surprises in the first quarter approached 80%, the best showing since 2010. The question for the rest of 2017 is whether this represented a one (or perhaps two) quarter bounce in earnings driven by remarkably easy year-ago comparisons. Continued strong earnings growth in the second half of the year, when comparison become less favorable, could support the view that we may be able to relieve some of the valuation pressure through better earnings (reduce the P/E ratio by increasing the E rather than just decreasing the P).
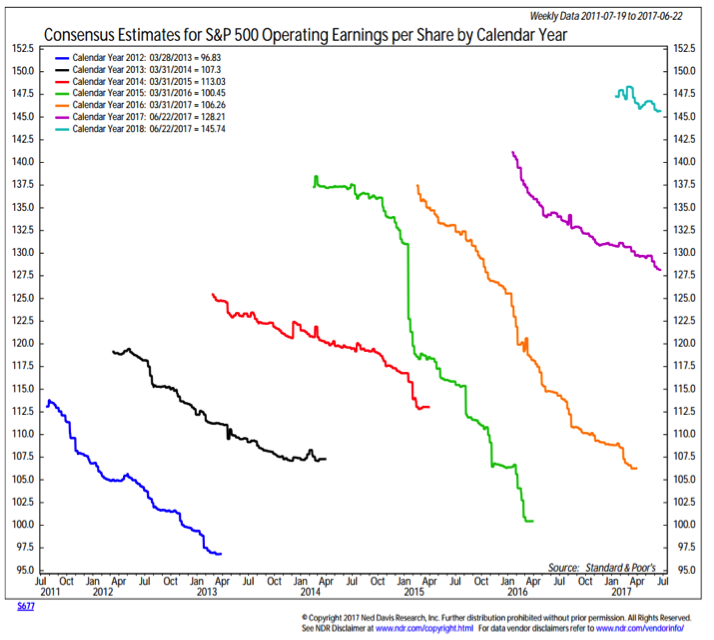
We have gotten used to the trend in recent years of high initial estimates for growth and earnings that come down over time. From an earnings perspective, 2017 seems to be generally following that well-trod path. While expectations for this year have not been reined in to the same degree as was seen in 2015 and 2016, they have drifted lower. Breaking this pattern, and seeing expectations hold steady or even rise over the course of the second half would speak to underlying economic strength and an improving fundamental backdrop.
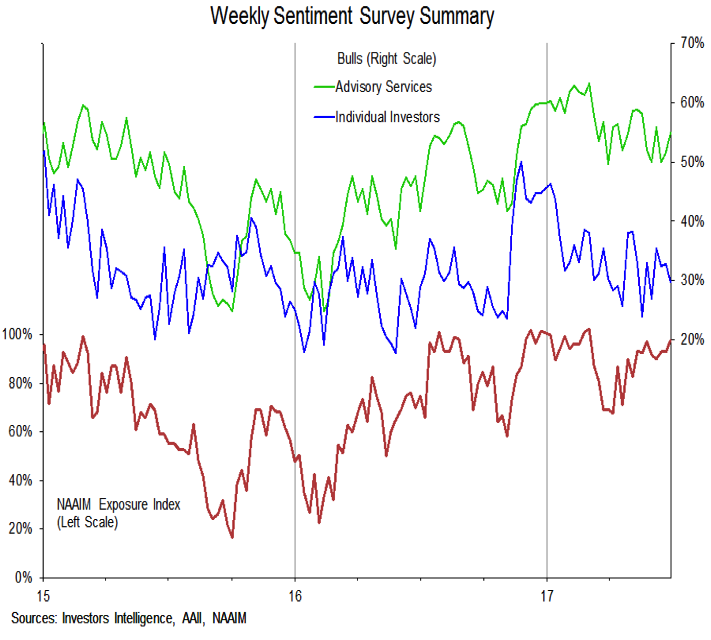
Investor sentiment can be measured in real time in two ways: listening to what investors say, and tracking what they do and how they are positioned. Listening to what investors say, sentiment suggests complacency and some underlying bullishness. The exuberant optimism that typically signals higher risk environments for stocks, however, is not apparent in the sentiment surveys. Bullishness among advisory services and individual investors has waned over the course of the first half, although the 55% bulls among advisory services is still a historically elevated reading. The NAAIM exposure index shows that active managers continue to hold elevated exposure to equities. This index can remain elevated for extended periods of time.
In terms of tracking what investors are doing and how they are positioned, we can look at fund flows and aggregate exposure. Equity funds have seen inflows over the course of the first half 2017, which is a marked difference between this year and last year (when equity funds saw persistent outflows until after the presidential election).
continue reading on the next page…

: Showing Some Signs of Emerging Strength")
