Most people are probably aware that US High Yield credit spreads are trading at the bottom end of the range – almost 1 standard deviation below the long term average. This is a fact. But what is not a fact is whether credit spreads are *too* low…
It’s worth examining this issue, because another way of looking at it is to say that there is very little credit risk premium on offer – and most longer term investors prefer to look for larger not smaller risk premiums.
I talked about US High Yield credit spreads and the indicators to watch and thoughts on the outlook in the latest weekly report.
This article looks at one of the key charts and indicators and why really every investor should be across high yield credit.
The chart shows HY credit spreads against an indicator of economic conditions, and from first glance it almost looks as though credit spreads are trading exactly where they should be based on the underlying economic fundamentals.
US High Yield Credit Spread Chart – 1996-2017
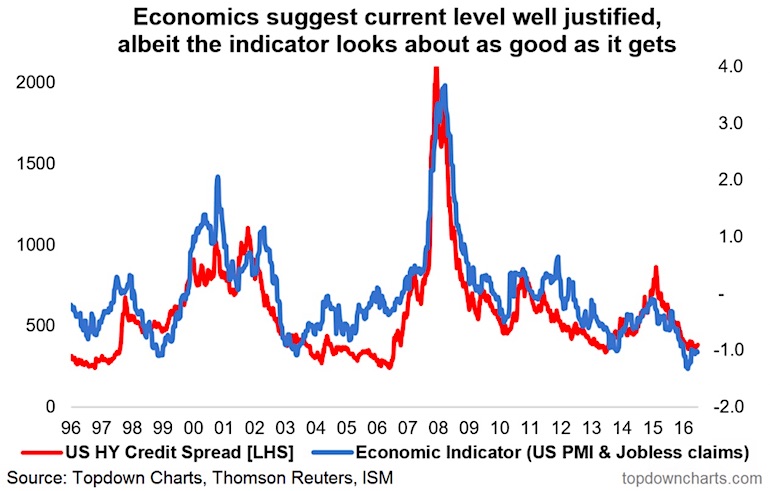
The indicator combines the signals from the US manufacturing PMI and initial jobless claims. It provided an early warning in the form of divergence in the lead up to the financial crisis. At other times it acted as a confirming indicator. And other times yet, it signaled a bottom when it went to extreme lows and turned up.
By the way, for that indicator the lower it is the better/stronger the economic conditions signal.
ALSO READ: Corporate Credit Markets: Party Like It’s 2017!
At present there is no divergence. It certainly confirms the low spreads. But it is at a very low point and has turned up – similar to 1999, 2003, 2010, and 2014. So from a risk management standpoint that type of pattern could well develop and needs to be monitored.
In the report I mentioned, I also looked at the impact of rate hikes, spreads vs lending standards, the credit managers index, bank CDS, and equity volatility. There has been some, albeit thus far minor, deterioration in the lending standards and credit managers indicators, and we also have Fed rate hikes well underway. Thus, given how low credit spreads are, my view is that US HY credit should be front of mind.
Aside from income oriented investors and those managing diversified or multi-asset portfolios, most investors should take notice of US HY credit given its high correlation with equity market volatility, bank CDS, and broader financial conditions. So keep watching the charts.
For more and deeper insights on the global markets, good charts, and actionable investment ideas you may want to check out my Weekly Macro Themes – our institutional service. Thanks for reading.
Twitter: @Callum_Thomas
Any opinions expressed herein are solely those of the author, and do not in any way represent the views or opinions of any other person or entity.


