The good news is that price volatility on the S&P 500 has calmed down somewhat and that the index remains above the recent lows. The bad news is that prices remain under a mountain of overhead supply having run out of gas close to the underside of the top.
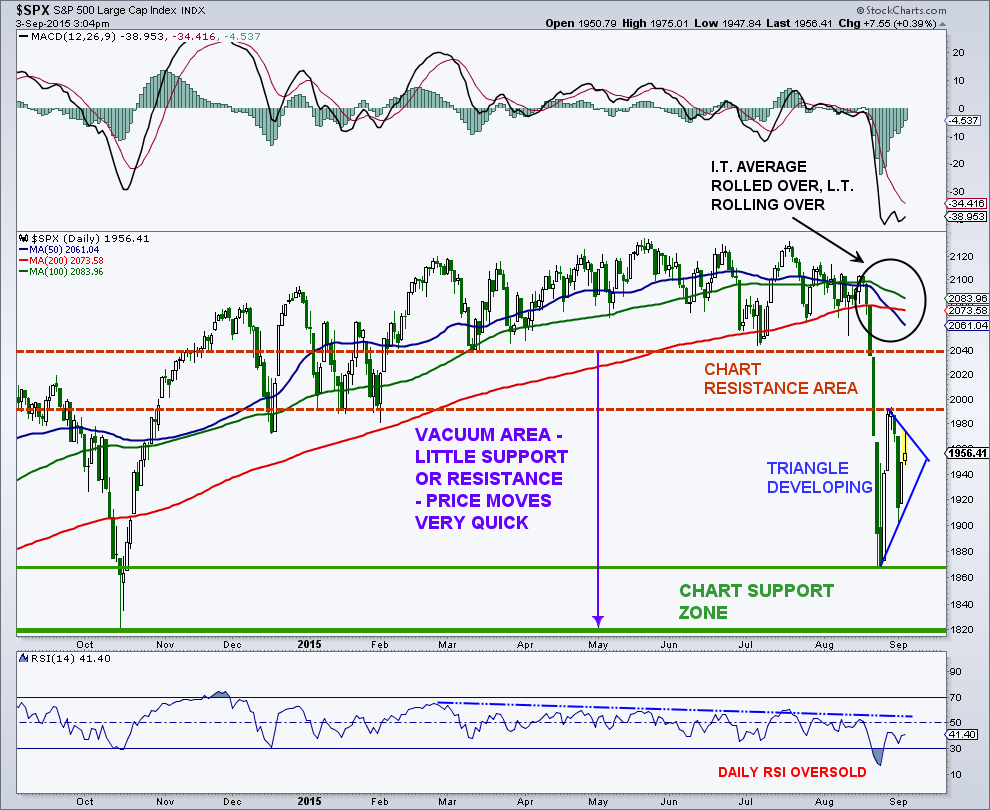
The current boundaries for the S&P 500 are 1,994 on the upside and 1,867 down below. It certainly appears that a triangle is developing since last week’s panic low. Triangles are continuation patterns of the prior trend, so this pattern, if it continues to play out, suggests another leg lower which takes out the 1,867 level. This, by itself, will create mass pessimism (amidst the volatility), and potentially the last leg of this initial decline. A breakdown of the triangle would set up a measured move down toward the October lows of 1,820. This measurement is based on the size of the formation and where the apex of the pattern comes in. That would then set the stage for another rally that completes the much larger top that runs from 1,820 to 2,135.
If the stock market index breaks to the upside, and negates the continuation triangle, the next key area of chart resistance is the breakdown area of 2,040. The index may also run into the declining 50-day simple average by that point. The 50-day moving average has crossed below the 100-day as well as the 200-day, a sign of potential longer-term problems. A rally to the 2,040 region would then represent another key moment for the bull market. Key questions to ask IF this occurs: Did the market leaders come back to shine during the rally? Did we see nice action by the higher beta indices (Russell 2000, NASDAQ 100, S&P 400.) Was there broad participation by the sectors that have led the bull market? Did sentiment stay very bearish during the market rally?
If yes, then maybe this was just the strangest and most disguised cyclical bear market in history. Yes the indices didn’t correct by 20%, not even close. But, more than 80% of stocks on the NYSE dropped below their 200-day average, so certainly under the surface, there was a bear market. What would back this argument up quite strongly is the massive deterioration in market sentiment and market internals. I have seen some indicators move to more pessimistic and fearful readings than in the 2008/2009 mega bear market. This would be the “wild card” call that many are not looking for, including myself, but certainly possible.
If the rally off the lows remains weak, and we can answer most/all of the above questions with a no, and then prices start to rollover, then a lot more pain could be coming. The monthly MACD has seen a bearish crossover, last times were 2008 and 2000. The S&P 500 has busted its bull market trendline and sits below the 10-month simple and 19-month exponential averages. The 17-week EMA is only 5 points from crossing the 43-week EMA, last times were 2011, 2008, 2000. The 43-W RSI is below 50, my bull/bear demarcation line.
So stay tuned, the next couple of months should be very interesting. I think both intermediate-term and longer-term investors should stay cautious. And certainly, I’d expect more price volatility.
If you are interested in my premium newsletter, please contact me at arbetermark@gmail.com. Thanks for reading and good luck in the week ahead.
Twitter: @MarkArbeter
The author does not have a position in any mentioned securities at the time of publication. Any opinions expressed herein are solely those of the author, and do not in any way represent the views or opinions of any other person or entity.
")


")
