 By Andrew Kassen Yesterday morning we took a brief survey of the damage sustained by Gold and the rest of Metals complex since last Friday morning. Since bottoming in early Asian trade last evening, the complex has staged an impressive relief rally in keeping with the regime of heightened volatility introduced late last week. Precious metals are not yet done sorting through the consequence of the historic bull run begun 12 years, it seems. Specifically, gold reached as low as -31% off its September 2011 high at 1924, before rallying 6% overnight from the 1321.5 low put in at 8:45 p.m. ET. Such a staggeringly swift and otherwise epic flush begs the question: does Gold remain out on a limb? Or has its 18-month consolidation and the brutal mean reversion of the past few days returned the yellow metal to a more plausible valuation?
Gold receives more history-focused, contextualized treatment than most stocks, currencies or commodities, but with so much going on in the short-term it becomes easy to neglect where price wandered in previous weeks, let alone months and years past. As a refresher, here’s the full scope of Gold’s rise off $255 amidst the deflation of the dot-com era (click image to zoom):
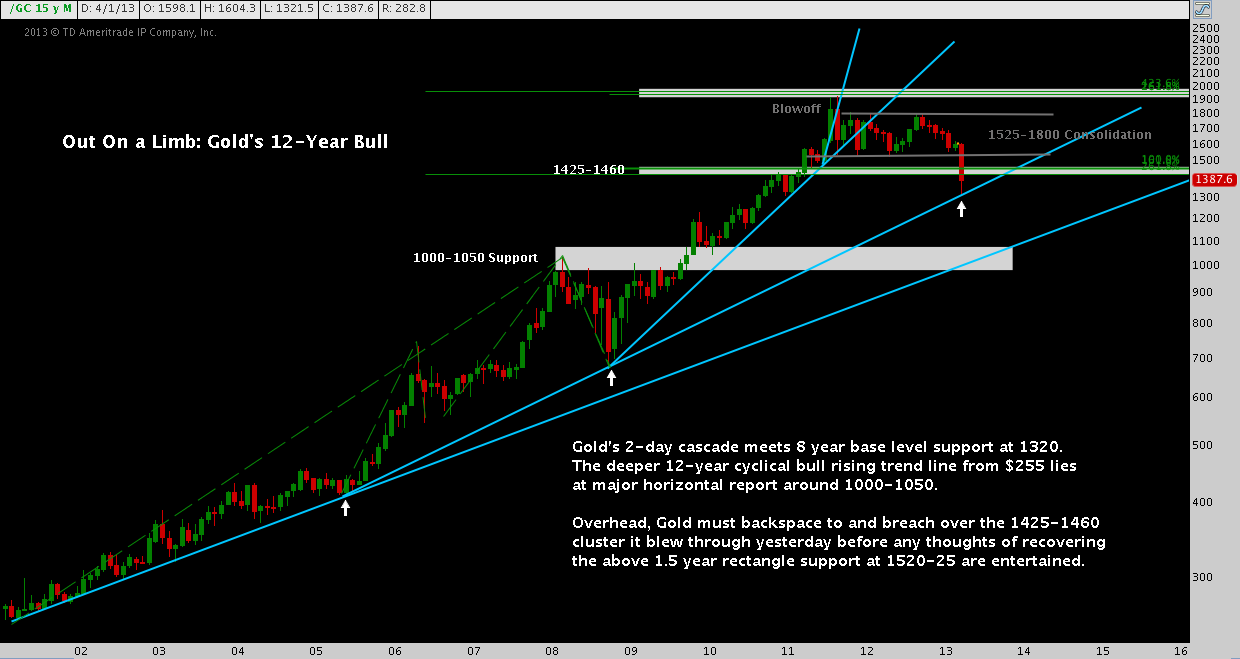
Gold very literally moved out on a limb – again and again – in a series of steeper-graded rising trend lines. In the end, a near-parabolic 2-month, 30% move brightly burnt the building momentum down to the ashes of a protracted consolidation. Only 18 months later did gold emerge from the 275 point range that followed.
One of my favorite wide-sweep views of any instrument exhibiting that unmistakable succession of baseline, bubble and blowoff is the Bump and Run Reversal Top. (In fact, I just did a write-up on Apple’s BaRRT here). Gold is a classic example (click image to zoom):
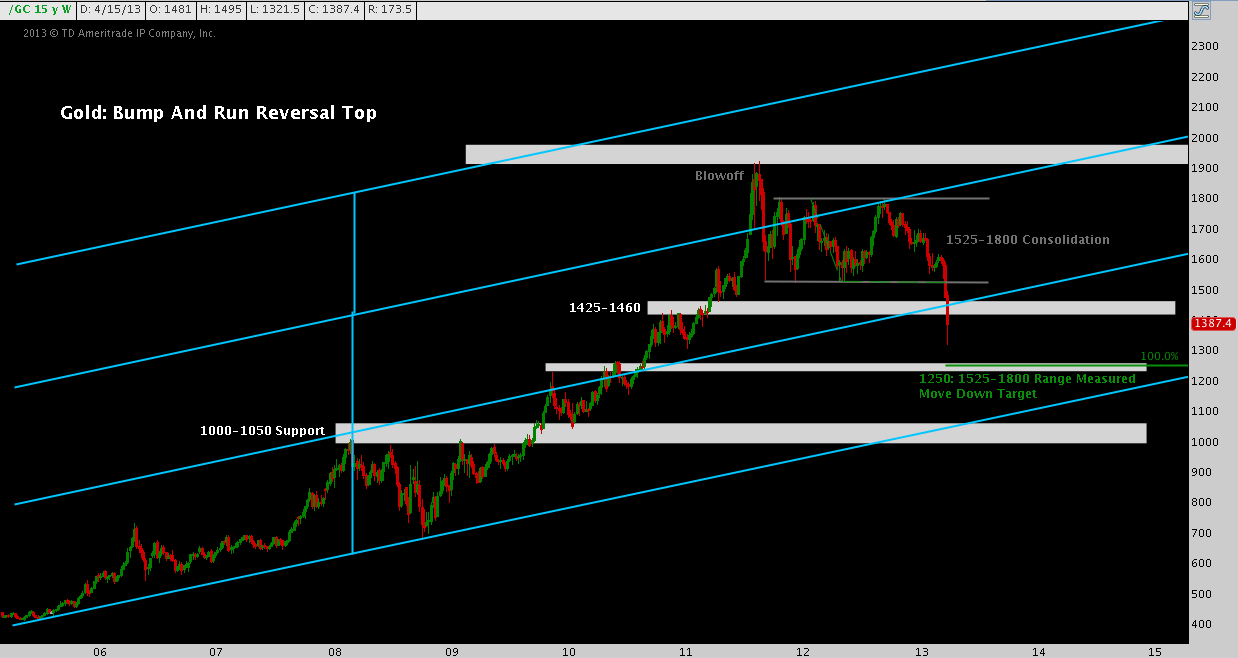
As with the first chart, Gold’s Bump and Run spells out the importance of 1425-1460 and then 1000-1050 as major levels of contention. Aside from those, the 2011-2013 consolidation rectangle that unfolded between 1525-1800 carries a measured move down target of 1250, itself a major support level from late 2010 through mid-2011.
Through the lens of these longer-run views, we instantly recognize the magnitude of the past few sessions: the range of April’s uncommonly large candle was essentially created in the past 2 trading days! At the same time, Gold’s run up puts this “cataclysmic” move down into a more balanced relief: the metal has declined dramatically; but the technical force of the drop is heavily mitigated as we consider the long, skyward trajectory only modestly retraced.
The retrace last night off of 1321.5 to above 1400 brings the 1420-1460 fibonacci cluster zone back into focus (and quite a bit faster than I would’ve expected yesterday!). Though Friday-Monday seemed like an uninterrupted drop, there were a series of dead cat bounce formations along the way. The technical result of those false starts is a series of hooks from which we can now infer short-term support and resistance. Check out the levels that result:
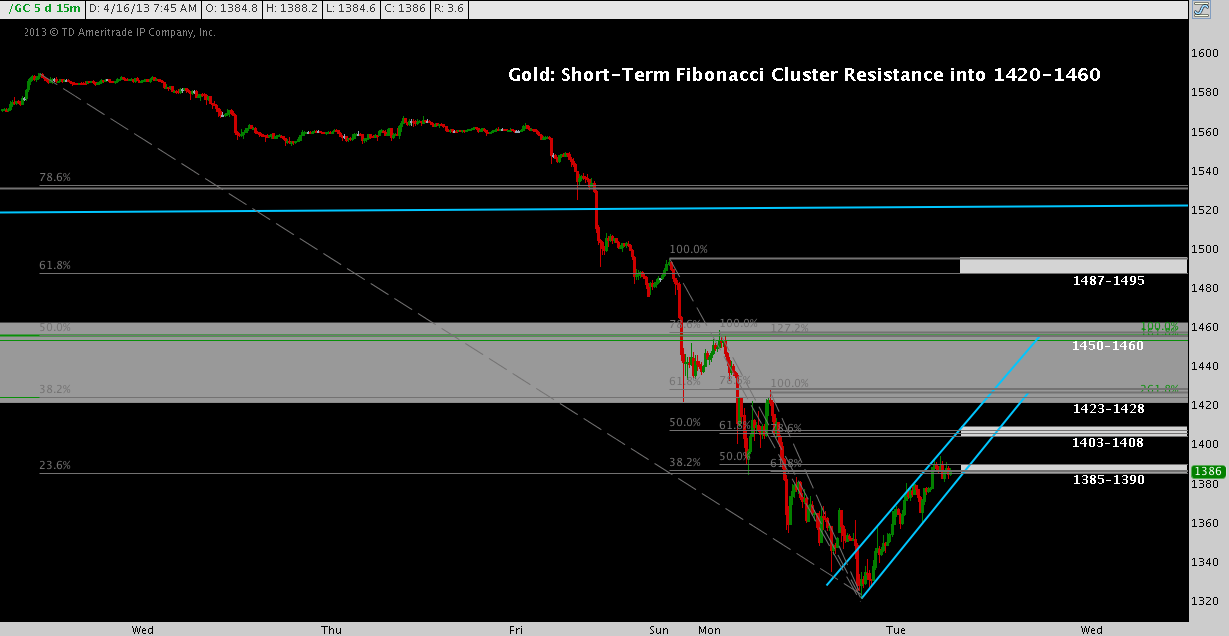
Technical note: It’s important to note these fibonacci levels aren’t potential reversal points – or at least, they aren’t that alone. I treat them more broadly as points of contention – focal points from which a defined range of probable technical outcomes can occur. Below 1460, gold remains on its heels and a reversal can come from any one of these levels. But any reversal would only be development to react to, not anticipate. As a trader, the utility of these levels is that they perceptivel pick out out points of likely consolidation. Whether that means a flag forms from which a long breakout then occurs or a mini-head and shoulders top emerges that spells out a reversal, these price windows create setups. In turn, these setups offer two indispensable benefits: 1) time to strategize and 2) discrete levels around which to formulate risk parameters, usually with an excellent ratio of reward-to-risk.
Longer-term, there’s no reason to presume gold’s or other precious metals’ corrective moves are finished. The studies we’ve included here pick out 1250 and even 1000-1050 as major levels of support that will remain in play as long as the metal stays below 1425-1460. Along those lines, Gold could easily ratchet through the resistance levels plotted on its 5-minute chart above to make a legitimate backtest of 1425-1460 before turning lower.
I will be keeping a close eye on this last chart, taking trades with an overarching downside bias (i.e. not precluding longs) between these levels – however that plays out – in smaller size until volatility dampens. Above 1460, the ceiling pushes out to the seemingly distant 1525 resistance level to which we bid a hasty goodbye just a couple sessions ago.
Twitter: @andrewunknown and @seeitmarket
No position in any of the mentioned securities at the time of publication.
Any opinions expressed herein are solely those of the author, and do not in any way represent the views or opinions of any other person or entity.
: Worrisome to Broader Market?")

: Important Breakout Retest")