By Andrew Kassen
The harrowing magnificence of AAPL’s rise-to-fall over the past 6 months has been a strange and winding cautionary tale.
A single stock bubble inflated as a market cap eulogy of its charismatic founder, the drop from $705 to $429 (last Friday’s close) has been in large part the market’s unfurling realization of Apple’s tactical fallibility as the flawless visage overlaid by the Steve Jobs cult of personality is slowly peeled back.
That’s the plausibly contrived response I give any time the debilitatingly complex “Why did Apple go down?” question is thrown at me. It’s as good as any I’ve read (and there are thousands of articles to read); mostly because it satisfying our deep yearning for narrative we have when unexpected and adversely “irrational” market events occur.
The stock, left to itself, is less comforting – a stock price bereft of its story is always deafeningly silent and final – but far more honest and clear. Here’s a unique look at the wide sweep of the “single stock bubble” on the weekly chart as short series of Bump and Run Reversal Tops (BaRRT) (click image to zoom):
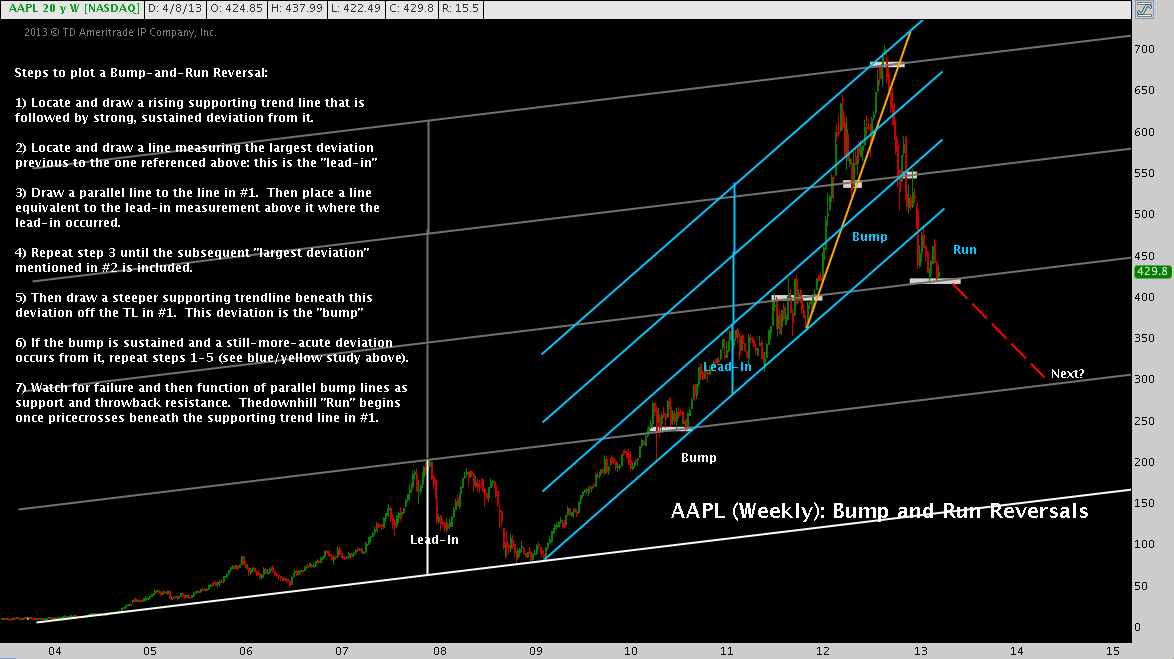
You’ve seen other charts like this before – maybe not a BaRRT, but the unmistakable image of a stock ceaselessly shifting through its momentum-driven gears. You’ll see them again if you look, on every time frame (there are some excellent examples to view right now, in fact). Strength builds on strength, over-and-over as a stock, commodity or currency builds into an irrepressible run. And then as the “no way it can keep going at this rate” comments reach an apparent climax, it breaks still higher – frustrating the earnest expectations and erudite opinions of the greatest number of market participants. Before disappointing them all.
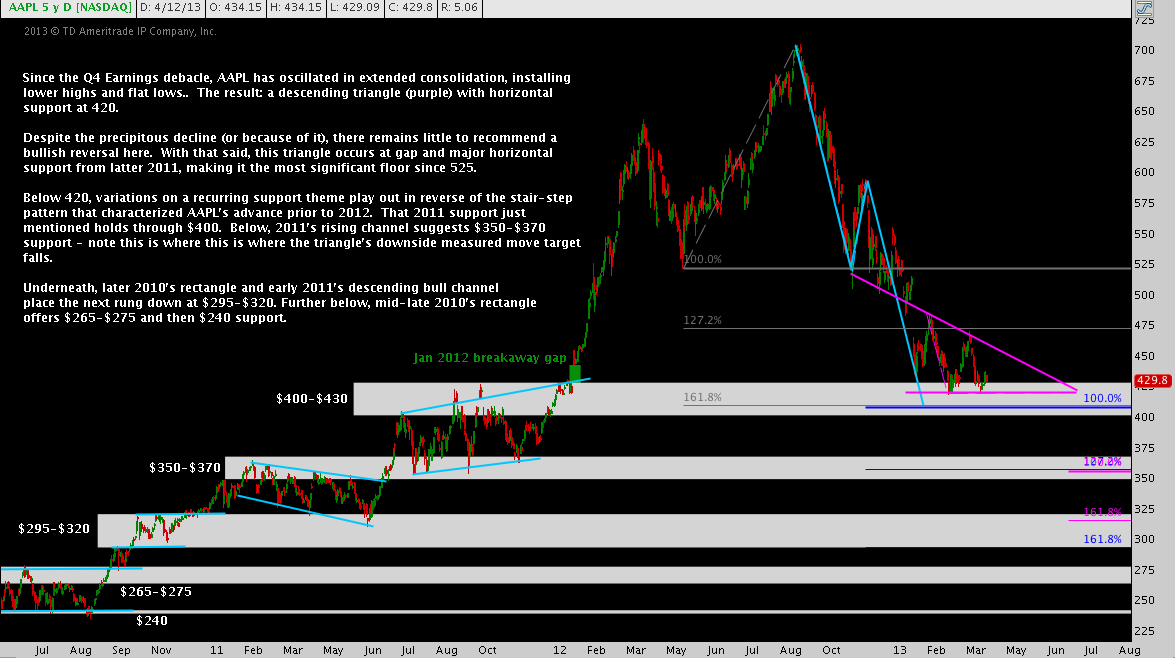
That is the rough-and-dirty sentimental landscape Apple trod across in the first 3/4 of 2012. Here’s a more granular look at the same period with attention given to how the stair-step move up of last year provides multiple support rungs on the way down (click image to zoom):
So: is it time for peak despondency on AAPL? The sobriety of these charts may give that impression (using words like “eulogy” doesn’t exactly help, either); but I’d say the answer is no.
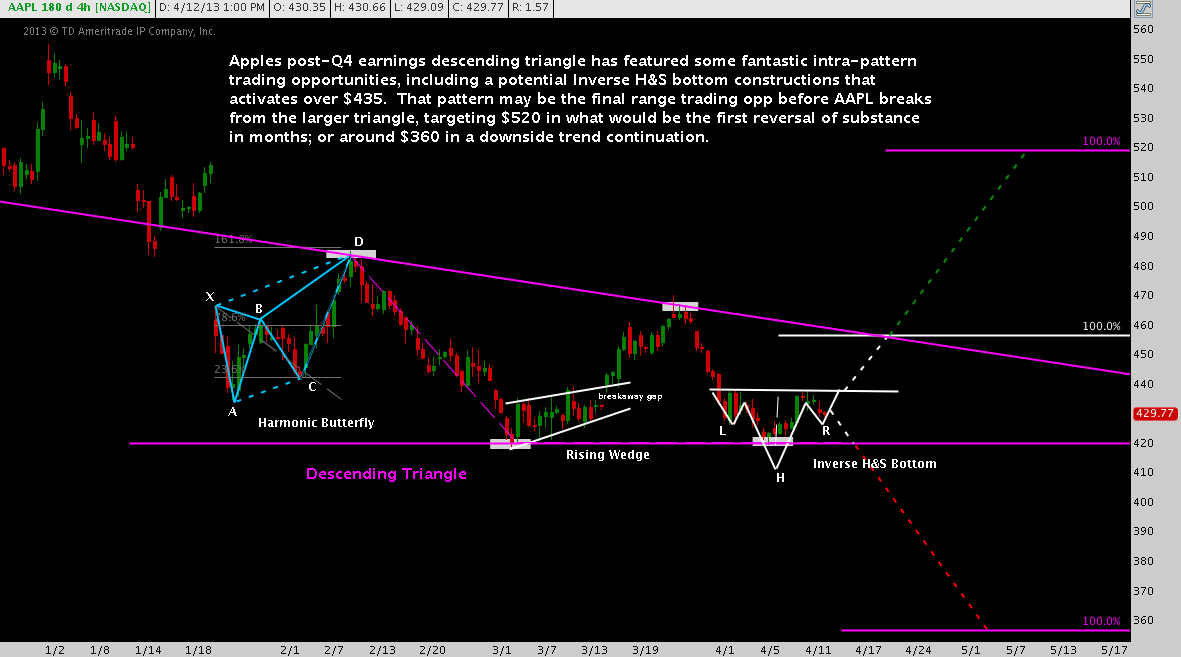
Thought any open market has an indelible memory, each moment in time is unique. So with the decisive down trend of the last 6 months in mind, consider the descending triangle consolidation underway since the Q4 earnings gap down in January (click image to zoom):
Is Apple bottoming above $420? That’s only slightly easier to answer than “Why Is Apple Going Down?” – which is to say, not at all.
Forget for a moment whether AAPL is “cheap” (remember the “Absurdly Low P/E!!!” argument bandied about by foam-flecked pundits in the high $600s when the stock was on its way to $1000?); and do yourself a favor by quitting deliberation over whether AAPL has reached its absolute trough here. For most investors, these are precisely the wrong questions to ask. Instead, look over the simple blank-slate, even-money descending triangle staring you in the face: a great technical canvas for several risk-managed trades across multiple time frames.
- Shorter-term, notice the Inverse Head & Shoulders setup: the pattern does not activate until its $435 neckline is crossed; but once that level is breached, a $457 primary target at the larger descending triangle’s resistance is up for consideration.
- Conversely, a break below the Inverse H&S’s head at $420 support is not just a break of that consolidation, but would also put a fine tactical point on the coincident descending triangle break that would occur there, providing an excellent opportunity for a short entry.
- In the medium-term, if the necessary momentum comes in resolution of the Inverse H&S consolidation would introduce a breakout in the descending triangle, targeting up to $520, or down to $360 (which you’ll note on the second chart above was the price fulcrum in 2011, before Apple got its endgame-inducing parabola-tracking supercharger).
One of the worst mistakes a trader or investor can make is to develop a calloused unwillingness to view a stock with new eyes, accommodate new information or consider new trades when things have not gone their way – for their point of view or their money – in the recent past. Whether that describes you or not – whatever your history with Apple (tumultuous for so many) consider that there are several setups here – and most assuredly others – offering fantastic soundly-managed R-multiples whether or not the stocks near-term fate is at last flipping over or further to fall.
Twitter: @andrewunknown and @seeitmarket
No position in any of the mentioned securities at the time of publication.
Any opinions expressed herein are solely those of the author, and do not in any way represent the views or opinions of any other person or entity.


