There have been several storylines within the U.S. equity markets rally.
Some show up front and center (AI stocks). Others not so much.
One oldie but goodie that hasn’t garnered as much attention is the Emerging Markets.
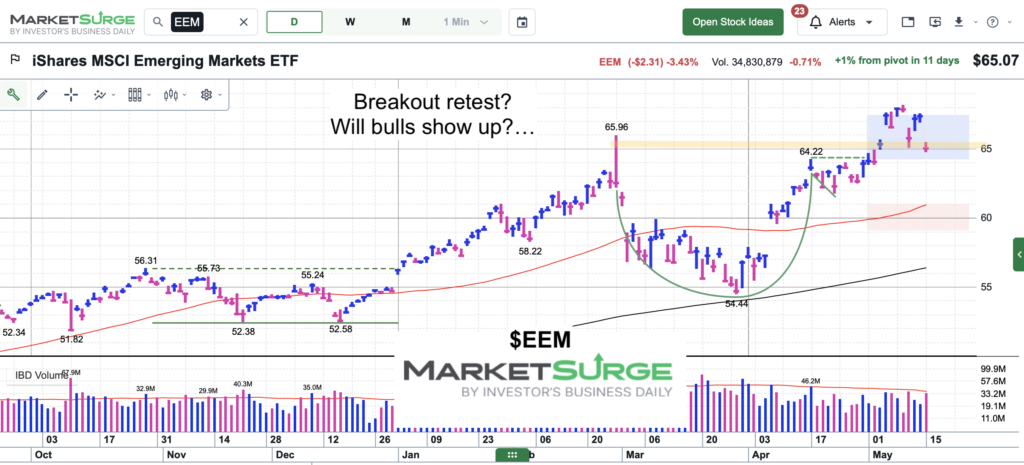
Today, we look at the Emerging Markets ETF (EEM) to highlight an important technical price level that EEM is testing… right now!
Note that the following MarketSurge charts are built with Investors Business Daily’s product suite.
I am an Investors Business Daily (IBD) partner and promote the use of their products. The entire platform offers a good mix of tools, education, and technical and fundamental data.
$EEM Emerging Markets ETF Chart
As you can see, EEM broke out to new highs before pulling back. This is often called a “retest”. Price is basically testing the prior resistance level from above (now support). Will it hold? Bulls sure hope so!
Twitter: @andrewnyquist
The author may have a position in mentioned securities at the time of publication. Any opinions expressed herein are solely those of the author, and do not in any way represent the views or opinions of any other person or entity.