Emerging Markets In Isolation
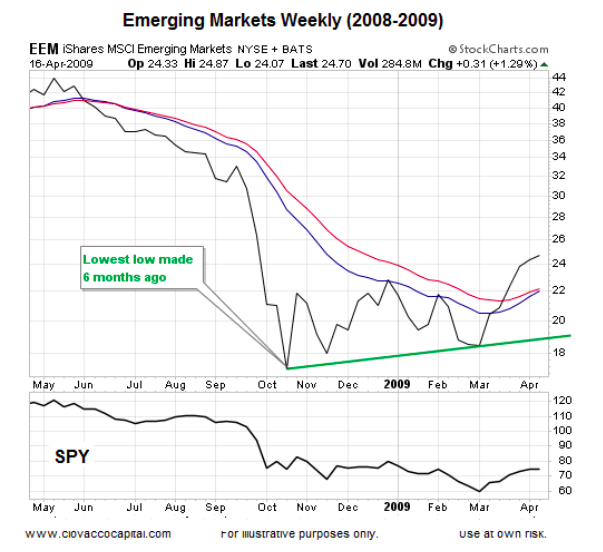
If we perform the comparison using emerging markets in isolation, the “keep an open mind about bullish outcomes” case gains some additional traction. Five weeks after SPY bottomed in 2009, EEM already had a much improved look from a weekly trend perspective.
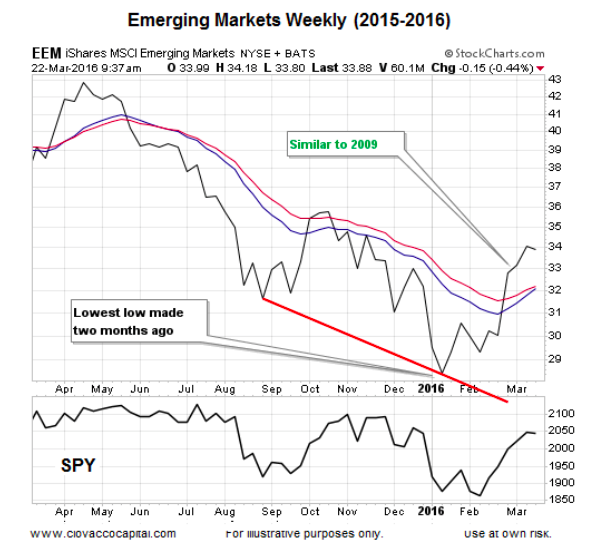
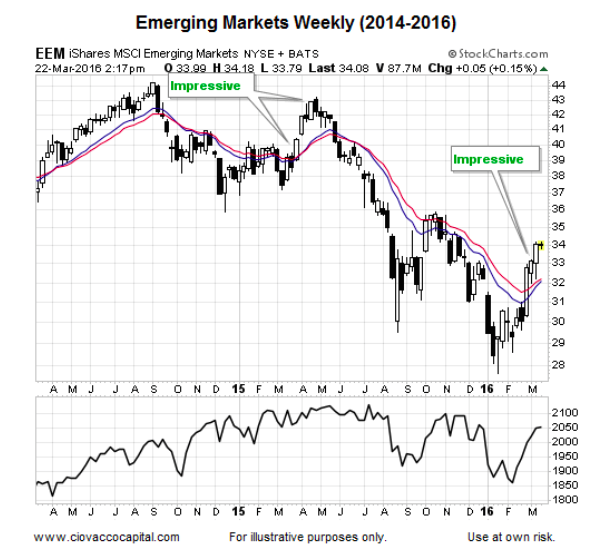
While a new weekly lower low was made by EEM just two months ago, the turn on the weekly chart looks similar to the bullish turn in 2009. The 2016 reflation case will pick up additional steam if the chart below can make a higher high (above the October 2015 high) and avoid making a lower low (below January 2016 low). We can learning something regardless if the chart continues down a bullish path or reverts to a downtrend.
2008: Rising Inflation Expectations
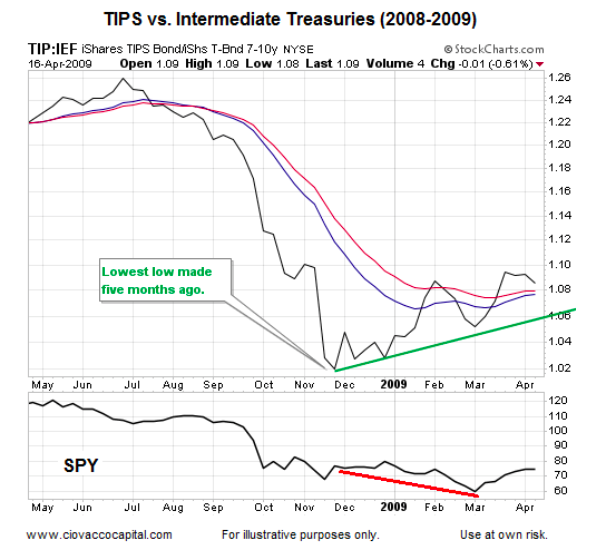
The TIP:IEF ratio hinted at rising inflation expectations by putting in a bottom months before the S&P 500 turned. The ratio began making a series of higher lows late in 2008 (see green line).
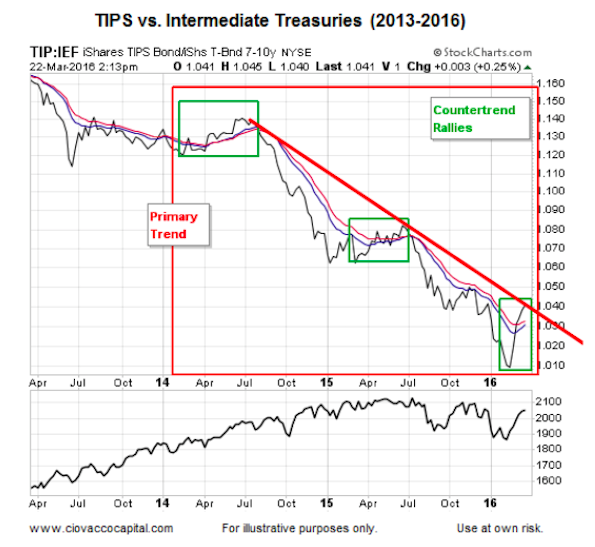
The TIP:IEF ratio has popped in recent weeks, but thus far it is difficult to say it looks much different from recent countertrend moves (compare green boxes below). Although the ratio made some impressive progress inside the 2014 and 2015 green boxes, the progress was fully retraced when the primary downtrend resumed (red box).
Looking at EEM in isolation, the same “is it a new trend or another countertrend rally” question comes up when we compare the current impressive rally with the impressive weekly rally in 2015.
Moral Of The Story
Since numerous reflation-friendly ETFs have taken a leadership role during the current rally in risk assets, it is prudent to respect the reflation case. However, the jury is still out on the new bullish trend vs. another countertrend case.
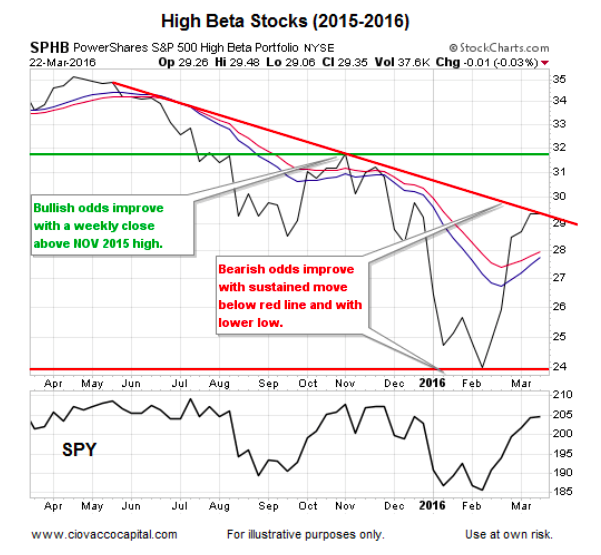
One easy way to keep an eye on the health of the reflation case for stocks is to monitor some of the recent leaders, such as EEM, EWA, IYT, SPHB, and XRT. If these ETFs and the ratios presented in this article go on to make important new highs paired with higher lows, the reflation case will most likely be alive and well. Conversely, if the ETFs and ratios fail to make higher highs above October/November 2015 highs and subsequently print lower lows, the odds for a sustained reflation rally will begin to drop fairly rapidly.
Thanks for reading.
Further reading from Chris Ciovacco: “Buyback Blackout Period: Should Investors Be Concerned?“
Twitter: @CiovaccoCapital
Author or his funds have long positions in related securities. Any opinions expressed herein are solely those of the author, and do not in any way represent the views or opinions of any other person or entity.

: Showing Some Signs of Emerging Strength")
