Are things really bad out there?
Without a doubt, there is no shortage of things to worry about. From slowdown in China to volatility in emerging markets to continued deceleration in the global economy to the Fed possibly committing a policy error by getting on a tightening cycle… it runs the gamut.
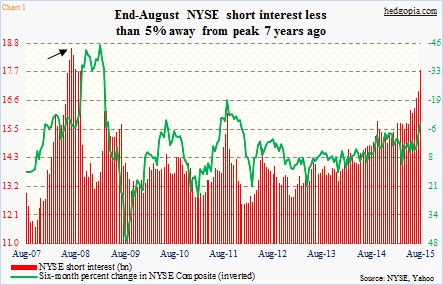
But is it comparable to the days and weeks leading up to the financial crisis? You would get that impression if you look at Chart 1 below. As of August 31st, NYSE short interest stood at 17.77 billion – less than five percent away from the peak seven years ago (arrow in the chart). The world was in the midst of a crisis back then.
Short interest on the Nasdaq Composite is no different. Directionally, it has been trending higher – 9.08 billion at the end of August – although there is a ways to go before it catches up to the September 2008 high (black arrow in Chart 2 below), some 23 percent away. During the financial crisis, it started rising at the end of October 2007 and kept rising, until it crested 11 months later.
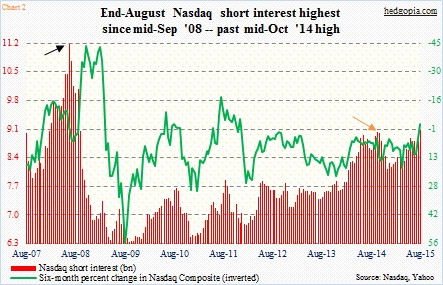
So the question is, would the red bars on the right side in Charts 1 and 2 in due course begin to mirror those on the left or would they begin to recede as has happened multiple times in the current bull market? The latest contraction (orange arrow in Chart 2) took place as stocks bottomed in the middle of October last year after a nearly 10-percent drop in the S&P 500 Index. Nasdaq short interest dropped from 9.02 billion to 8.12 billion by the end of December.
As to the possible path short interest might take going forward, it is not even worth a guess. But a few other things are worth pointing out. The buildup in short interest is coming at a time when non-commercials are beginning to aggressively lean bearish – seen through how they are positioned in S&P 500 and VIX (Volatility Index) futures.
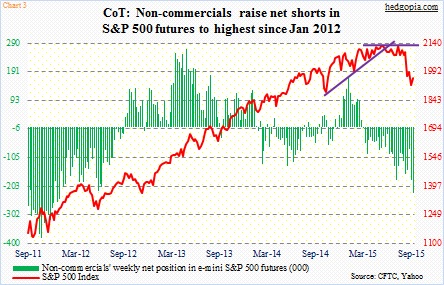
In two weeks, large speculators have increased net shorts in S&P 500 futures by 200 percent, to 226,926 contracts – the highest since January 2012 (Chart 3 below). These are holdings as of last Tuesday. Interestingly, in the week leading up to that the S&P 500 added 55 points, but this did not discourage these traders from adding to their net shorts. Net shorts went up 26 percent in the latest week.
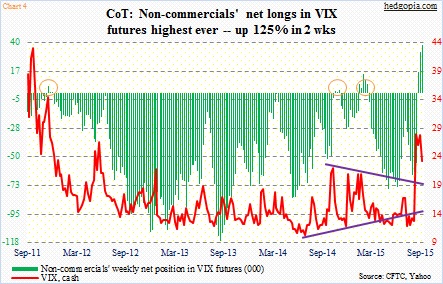
It is the same trend over at VIX. In five weeks, non-commercials have gone from net shorts (-64,445) to net longs (37,925). Net longs have never been this high. Here is the interesting thing. In the past, whenever these traders have shifted from net shorts to net longs, sooner or later spot VIX has tended to peak (circles in Chart 4 below), which then acts as a tailwind for stocks. Indeed, when on August 24 stocks made a low and then reversed, spot VIX did the same, reversing after making a multi-year high of 53.29. Since that low, the S&P 500 is nearly 100 points higher, and VIX has been more than cut in half. Will this persist?
Bulls hope so. While the sudden rise in short interest and net shorts shows a rising level of conviction on the part of bears, this is also a great opportunity for bulls to force a squeeze – along the lines of what transpired in the wake of the mid-October 2014 bottom in stocks. Can they deliver?
There are a few differences worth pointing out between that low and now.
In Chart 5, the green line is a ratio of 12-month average of NYSE margin debt to margin debt. Margin debt made an all-time high of $507 billion this past April, and has since dropped to $487 billion (as of July).
read more on the next page


