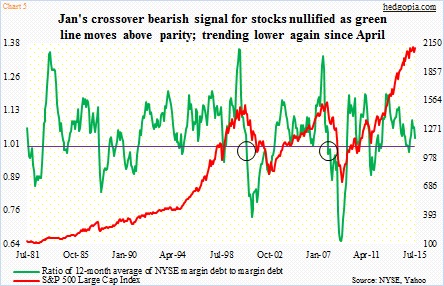
In recent months, the pace is decelerating. In April, it jumped $70 billion year-over-year, but slowed down to $27 billion in July. Hence the importance of the green line. In the past, whenever it drops below one, stocks suffer (circles in the chart). In January, it did cross over, but was immediately nullified as debt picked back up. In July, it dropped 3.5 percent. If August sees a similar drop – possible given the 6.3-percent drop in the S&P 500 – the ratio drops below parity again. Hence worth a close watch.
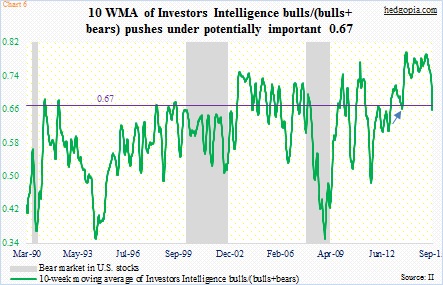
Also worth a watch is Chart 6 (below). Last week, Investors Intelligence bulls were 25.7 percent – the lowest since December 2008. It almost feels like a washout – a total capitulation. Although bears were only 27.9 percent – nowhere near panic highs. As a result, the number of investors expecting a correction is rather large – in the 40-percent range the past six weeks. Nonetheless, the sharp drop in the number of bulls has taken a toll on the green line in the chart. It represents a 10-week moving average of bulls/(bulls+bears). There is a line drawn at 0.67 – potentially an important number, at least going back 25 years. Once the line drops below 0.67 from above, more often than not it has shown a tendency to persist. This took place last week. With that said, back in October 2013 it stayed below one for two weeks, before turning back up.
The point in all this is this. There is an amalgam of indicators that could potentially be sitting at inflection points. Hence the significance of bulls’ ability – or a lack thereof –to regroup. Should they succeed, they have such a great opportunity to squeeze the heck out of shorts. A failure can change the tone of the market – for the worse.
This at a time when flows are currently not in bulls’ favor. In the August 9th week, U.S.-based stock funds saw outflows of $16.2 billion, following $3.9 billion inflows last week (courtesy of Lipper). Funds focused on U.S. shares saw outflows of $14.3 billion, while those specializing in international shares had $1.9 billion in outflows. This can always change. Once a bottom is in place, and stocks begin to move higher, that will/can attract flows.
Speaking of buying power, corporate buybacks have been a persistent go-to source for the last several years. Corporations have been more than willing to hike/dole out dividends and buy back shares, and take on debt, if the need be. In 2014, corporate buybacks were $679 billion, up from $149 billion in 2009 (courtesy of Birinyi Associates).
In this regard, it pays to keep a close eye on corporate debt issuance. First off, U.S. corporations are on course to issuing another record amount this year – the 6th consecutive year of north of $1 trillion (Chart 7).
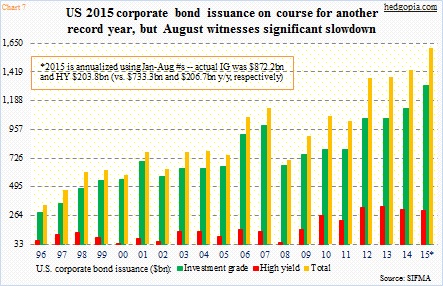
Year-to-August, $872.2 billion has been issued in investment-grade and $203.8 billion in high-yield. August, however, was merely $41.7 billion and $14.8 billion, respectively, versus a monthly average this year of $109 billion and $25 billion. Now it is too soon to be reading too much into this. It is just one month. Besides, August was also weak last year – $45.6 billion and $3.4 billion, in that order. Nonetheless, this is another one of those data points that need to cooperate with bulls if they are to be able to force a squeeze.
Thanks for reading!
Twitter: @hedgopia
No position in any of the mentioned securities at the time of publication. Any opinions expressed herein are solely those of the author, and do not in any way represent the views or opinions of any other person or entity.


")


