Volatility has been the name of the game in stocks in the past month.
Between the August 18th intra-day high of $209.59 and the August 24th intra-day low of $181.46, the SPDR S&P 500 ETF (SPY) lost north of 13 percent. All in four sessions! Then from that low to the intra-day high last Thursday, it rallied in excess of 11 percent. All this in 17 sessions!
Amidst the vicious sell-off last month, stock market bulls mustered courage and put their foot down. This is good. The bad? Shorts are not giving up. The former had – still do – a great opportunity to force a short squeeze, but the winds may be beginning to blow in favor of the latter – duration notwithstanding.
Here are three reasons why.
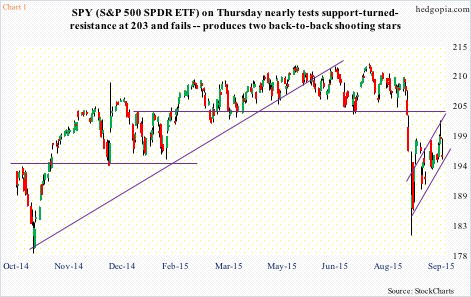
1. The selling last month accelerated once the ETF lost $203. This has been an important support/resistance line going back to November last year. When it was lost, nerves set in. Once things stabilize, it is not uncommon for the price to go test that level. This likely took place last week. Immediately after the FOMC decision on Thursday, stocks rallied strongly. SPY jumped 1.4 percent to as high as $201.84, but only to give it all back and then some. In the end, the session produced a shooting star – a bearish pattern – followed by another on Friday (see chart 1 below).
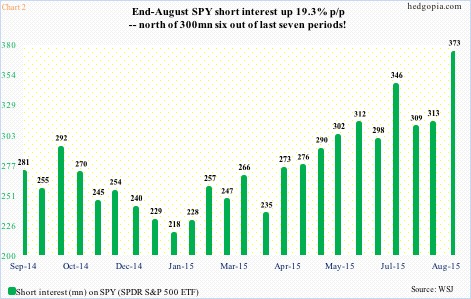
2. Shorts are staying put. As of August 30, short interest on SPY stood at 373.1 million, up a whopping 19.3 percent over the prior period (chart 2 below). The August 14-31 period in which this spike occurred also had the ETF rally eight-plus percent from the August 24th low, raising the odds of a squeeze. Nonetheless, shorts did not turn tail and run.
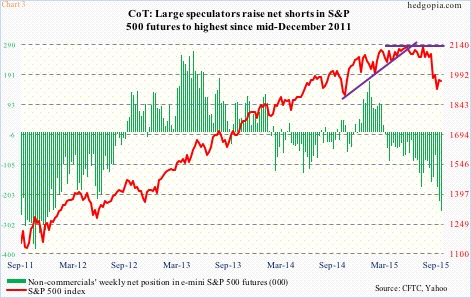
As a matter of fact, if we are to go by non-commercials’ holdings in S&P 500 futures, shorts are getting aggressive. As of last Tuesday, these traders were net short 258,900 contracts, up from 75,744 on August 25 (chart 3 below). Stocks bottomed on the 24th, and net shorts have progressively gone up since.
continue reading on the next page…

: Showing Some Signs of Emerging Strength")
