$SMH – Semiconductors Sector ETF “monthly” Chart
Earlier this week, I warned about a bearish gravestone doji pattern on the Dow Jones Industrial Average “monthly” chart.
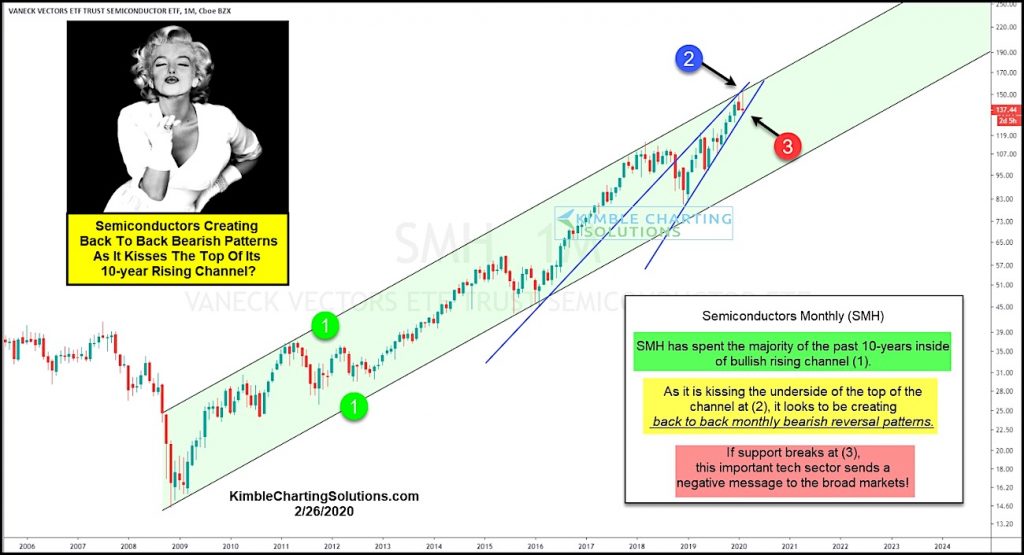
Today, I am sharing something similar on the $SMH Semiconductors Sector ETF (SMH)… and this “monthly” chart may also have bearish implications.
The Semiconductors Sector (SMH) has remained in a rising bullish channel for the past 10 years marked by each (1).
Over the past year, however, SMH has formed a shorter-term bearish rising wedge. And during the first two months of the new year, SMH has kissed the underside of these rising channels at (2) only to reverse lower and form back-to-back bearish reversal candlesticks.
SMH is now testing rising support at (3). If that support breaks, this tech leader will send a negative message to investors. Stay tuned!
Note that KimbleCharting is offering a 2 week Free trial to See It Market readers. Just send me an email to services@kimblechartingsolutions.com for details to get set up.
Twitter: @KimbleCharting
Any opinions expressed herein are solely those of the author, and do not in any way represent the views or opinions of any other person or entity.


 Ready To Break Out?")
")

