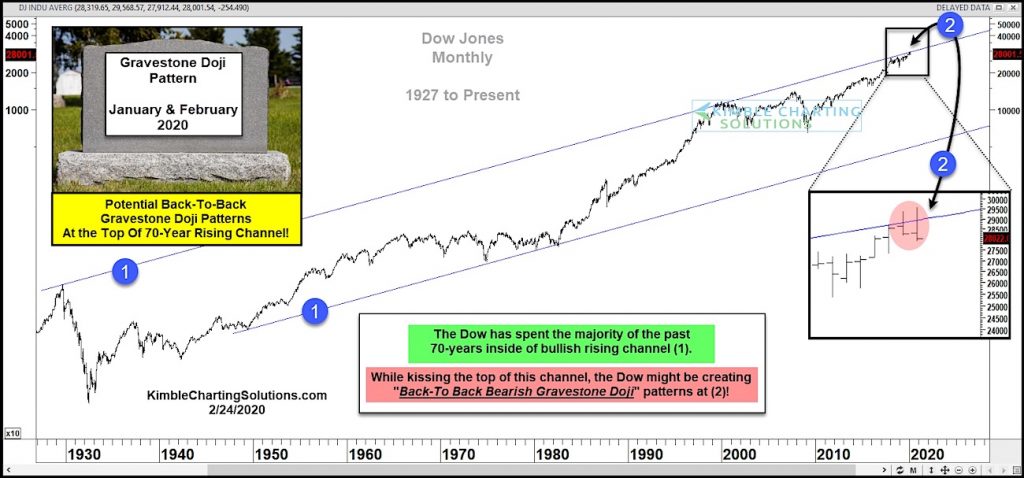
Dow Jones Industrial Average “monthly” Chart
The Dow Industrials have spent the past 70 years in a wide rising price channel marked by each (1). And the past 25 years have seen prices test and pull back from the upper end of that channel.
The current bull market cycle has seen stocks rise sharply off the 2009 lows toward the upper end of that channel once more.
In fact, the Dow has been hovering near the topside of that price channel for several months.
But just as the Dow is kissing the top of this channel, it might be creating back-to-back “monthly” bearish gravestone doji patterns at (2).
This “double whammy” would be bearish for stock bulls and could mark the beginning of a correction. Stay tuned!
Note that KimbleCharting is offering a 2 week Free trial to See It Market readers. Just send me an email to services@kimblechartingsolutions.com for details to get set up.
Twitter: @KimbleCharting
Any opinions expressed herein are solely those of the author, and do not in any way represent the views or opinions of any other person or entity.


