The Bear is Growling: Will All Those 2015 Technical Warnings Finally Spur A Bear Market?
I have been writing technical stock market commentary for a long time, first as technical market strategist, and second as a newsletter writer. Really no difference except the pay. LOL. One comment I have heard over and over again from RIA’s, portfolio manager’s, and individual investors is that you are not opposed to sticking your neck out and making a bold call. In other words, having a non-consensus view. Most on Wall Street avoid these bold calls, except of course the perma bulls and bears. Sometimes I look like a genius when making these bold calls and other times I get my head chopped off.
Hey, if you want a consensus call on stocks or the market, you don’t have to pay for any service, just be a robot.
This all leads me back to 2015 and the inability to officially turn outright, pound the table bearish on stocks. The warning signs for the stock market were there as many of my readers know. I’m referring to the weekly and monthly charts of the major stock market indices that I talk about later in this piece and have been talking about since the middle of 2015. Further warnings came from the lack of participation by many individual stocks and sectors.
In other words, the generals were holding up the market cap indices while the troops were in their own bear markets.
This statement refers to my writings on the stealth bear market last year.
The major problem with 2015 for me has to do with the vast amount of data I analyze other than just price. I look at market internal data as well as a huge amount of sentiment data. There are many clues to forecasting the market other than just price data. Many believe that the market is in most cases is efficiently priced. I do not. The late-90’s was a great example of this. This time it was the second and third tier biotech companies selling like they had the cure for old age. Momentum combined with story stocks (dot coms and phase 1/2 biotech’s) can be a very powerful lift for many stocks that end up (eventually) in the trash heap.
During and at the end of the August stock market correction last year is where it really got confusing in my eye. As price headed lower in a straight line, the internal data as well as the sentiment data I monitor all showed signs of extreme panic. Some of the readings I saw from market internals and sentiment matched what I saw at the market bottom of some of the worst bear markets of late (2002 and 2008/2009) and certainly during major stock market corrections within bull markets. Now here is where it gets interesting and confusing at the same time. These readings in August and September were also seen as the market was rolling over in 2000/2001 and 2007/2008 before the real damage occurred. This led to the vexing question: Was the decline in stocks during the Fall of 2015 the bottom of a stock market correction within an ongoing, but aging bull market, or the beginning of a bear market? Unfortunately, that was the unanswerable dilemma that I have been fighting with. Fortunately, and as a “newer” trader, I have sidestepped much of the market damage. In my newsletter, I started to share this comment on December 17 with subscribers: Personally, I remain heavily tilted toward cash, as I just don’t think the risk/reward is favorable enough for equity positions.
Another comment from long-term readers I have seen many times is my proclivity for honesty. No one knows the future. When I am uncertain about the markets, I am not ashamed to share that with readers. Investors are always looking for certainty, that’s why they watch the business channels and read the financial websites. Someone always has an opinion which is utterly deplorable, in my view. We don’t always have the answers, but in this business, that is useless for ratings. Guessing and acting confident while giving an opinion is just mental masturbation. During these times of uncertainty, I do give scenarios. If this happens, get bullish and if that happens get bearish. Sometimes that’s the best information I can share. Honesty!
So, what can be gleaned from the price charts, market internals, and sentiment?
On the daily chart, the S&P 500 Index broke the August low of 1,867 on an intraday basis before rallying late Friday. The trendline off the lows since August was taken out, but so far, this is only a one day break. At the same time, the 14-day RSI has recently cycled into oversold territory below the 30 level. This is the most oversold daily reading since the August market bottom. The daily MACD has also cycled down to near the level it printed in August and September, but is still headed lower with a very steep slope. Other than being oversold and sitting at chart support, there are few signs that this leg lower in stocks is complete.
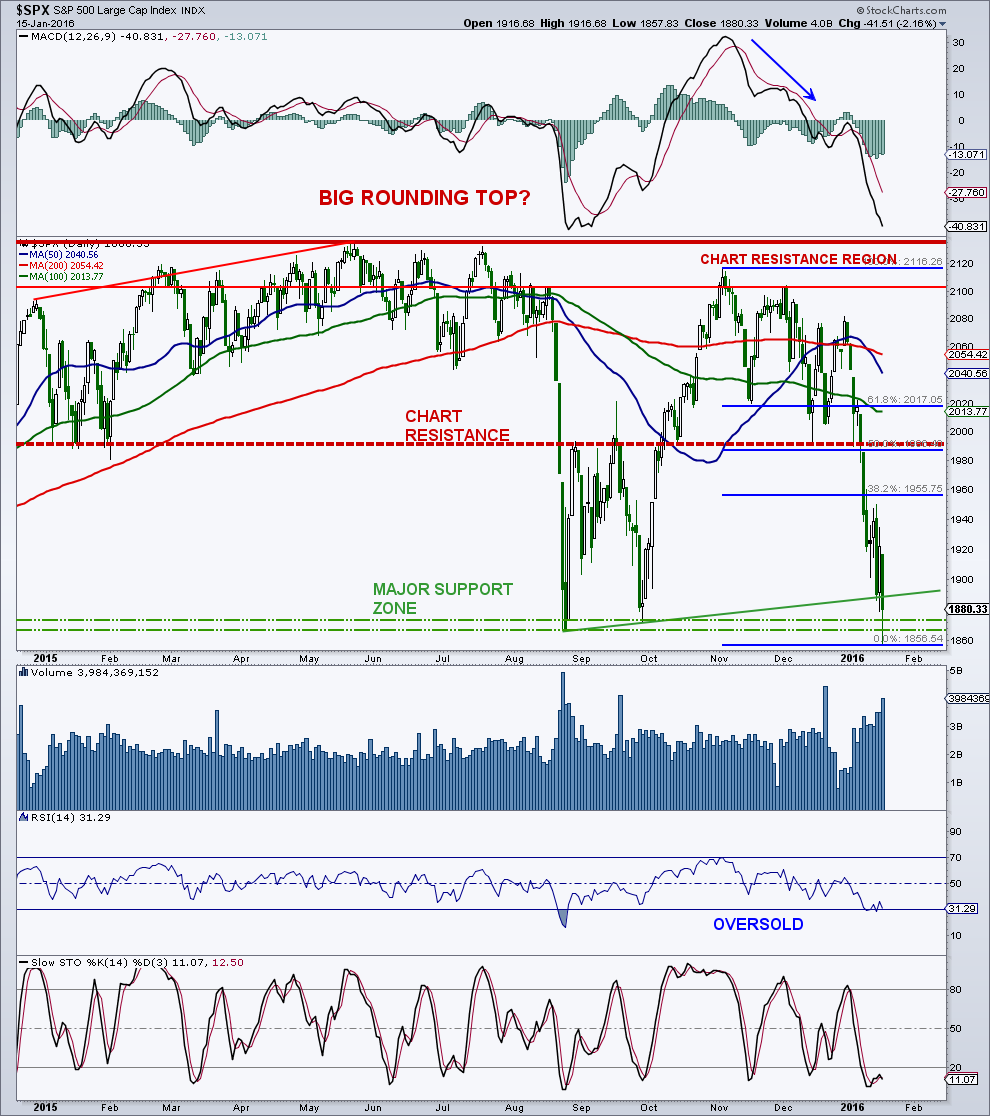
A word about momentum: Oversold in a bull market is a buying opportunity. Oversold in a bear market is useless as there is nothing to stop momentum from getting even more oversold. In addition, momentum ranges are different in a bull market and bear market. The normal range for momentum in a bull market is obviously higher than it is during a bear market. This is also true for sentiment, which I will touch on later.
So in the near-to intermediate-term, the S&P 500 could very well move to lower lows early next week between current levels and the October 2014 low of 1,820. Markets tend to bottom on Monday and Tuesday so with the holiday, maybe Tuesday or Wednesday is the final flush. A nasty opening followed by a big reversal on Tuesday or Wednesday would be the prescription for at least a short- if not intermediate-term stock market bottom. This does not preclude an all out wipeout in the next week or two as many indices such as the New York Composite, Russell 2000, S&P MidCap 400, and Dow Jones Transports have already busted through their August 2015 and October 2014 lows. These stock market indices are in no mans land (area of little price structure) sitting well above their highs in 2010 and 2011 (next real support).
Because the technical damage to the major stock market indices cited above is much worse than it was in August makes the S&P 500 Index and NASDAQ Composite much more vulnerable.
If the S&P 500 can find its footing next week, as some internal measures as well as sentiment are pretty washed out, it is certainly possible to see a bear market rally or a continuation of the bull market. If this turns out to be a bear market rally, it will probably be the type that doesn’t let you in, with very few pullbacks. Remember October 2014? It will cause the masses to turn bullish and proclaim that the worst is over. Projections for new all-time highs will start to reemerge from the perma-bulls. It will feel very good and Ms. Market will try to suck everyone back in. It’s like those poker games when someone finally goes all in out of desperation. It is at this time when Ms. Market will slap us in the face and head lower again. Especially if a bear market is to be born in 2016.
So if there is a market bottom next week, where can the next rally take us, whether it’s a bear market rally or the start and end to all the slop we have been through over the past year? My major focus is up near the last breakdown level near 2,000. The 1,980 to 2,005 region is loaded with potential pieces of technical resistance so I do not see any rally busting through that zone on an initial rally. This area has represented both support and resistance many times over the past year so it has great importance technically.
I have gone over the weekly and monthly charts quite a bit in the past six months, and needless to say, they still warn of more damage down the road for stocks. On the weekly, there was a bearish crossover of the 17-week and 43-week exponential moving averages last week, a longer-term warning signal. Confirming this was the drop below 50 by the 43-week RSI. The 50 level represents my demarcation level between bull and bear (major market correction) for the S&P 500. And the weekly MACD went bear cross last week.
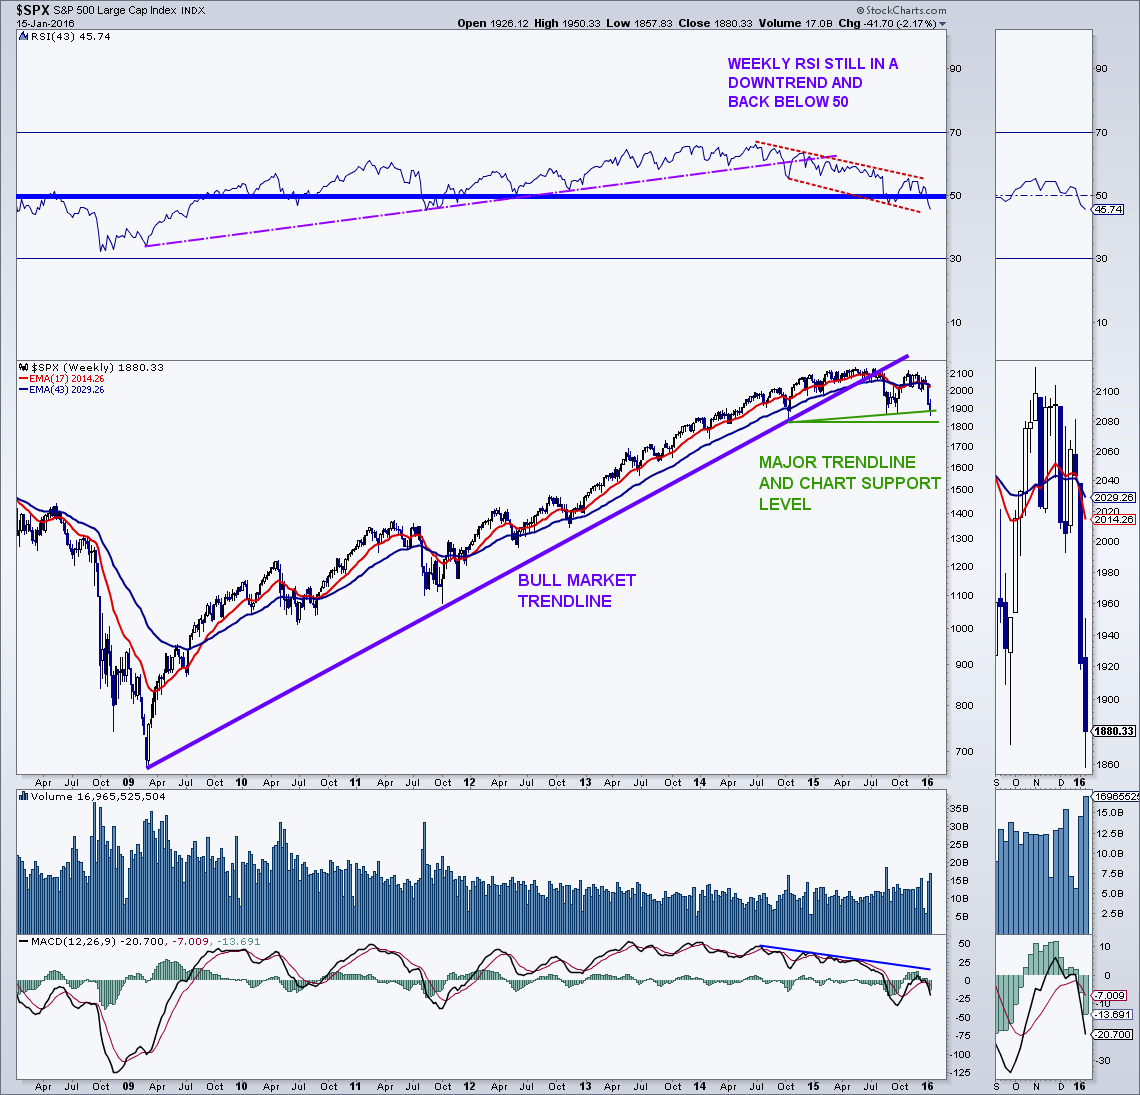
On the monthly chart, the S&P 500 is back below its 10-month simple and 20-month exponential average, with the 10-month average rolling over. The shorter average does remain above the longer average by about 54 points. The last bearish crosses of these two averages were in September 2008 and July 2001.
continue reading on the next page…


: Showing Some Signs of Emerging Strength")
