The monthly MACD has been on a sell signal since May while the 14-month RSI is below the key 50 level. Looking at recent history, a break below 50 is certainly a warning and a break below 45 has led to some real pain. The last couple of times that this RSI crossed below 45 were in early 2008 and late 2000 – both bear markets for stocks.
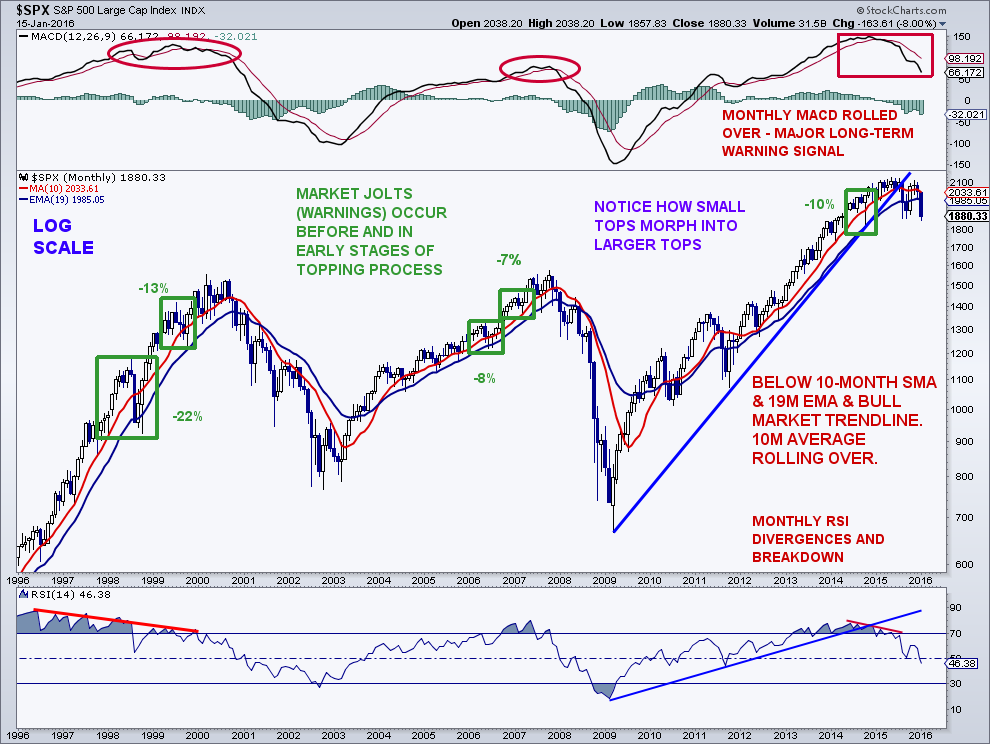
Longer-term, a strong break below trendline support off the October 2014 lows completes a very large rounding top formation and measures down to 1,565 or very close to the peaks in 2000 and 2007. Another measurement could be taken from the 1,820 low (assuming that eventually is busted) up to the 2,135 high for a target of 1,505. For the bulls to have any hope, I think the S&P 500 must see sustained trade back above the 2000 area in combination with many of the other major stock market indices recapturing their major breakdown levels.
I will also repeat that an increase in price volatility after a lengthy bull market is generally not good. Higher volatility is seen at major market tops and bottoms. Looking at the longer term charts of the major indices, it certainly looks like there is the potential for very large tops at this time.
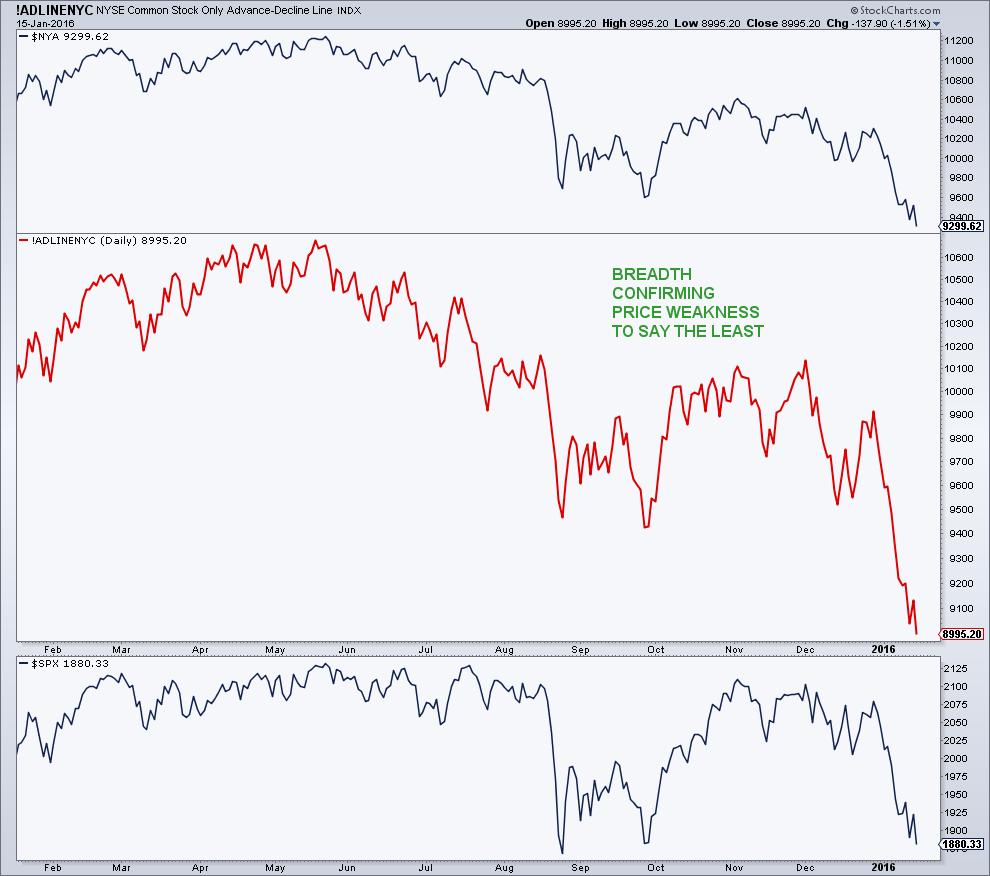
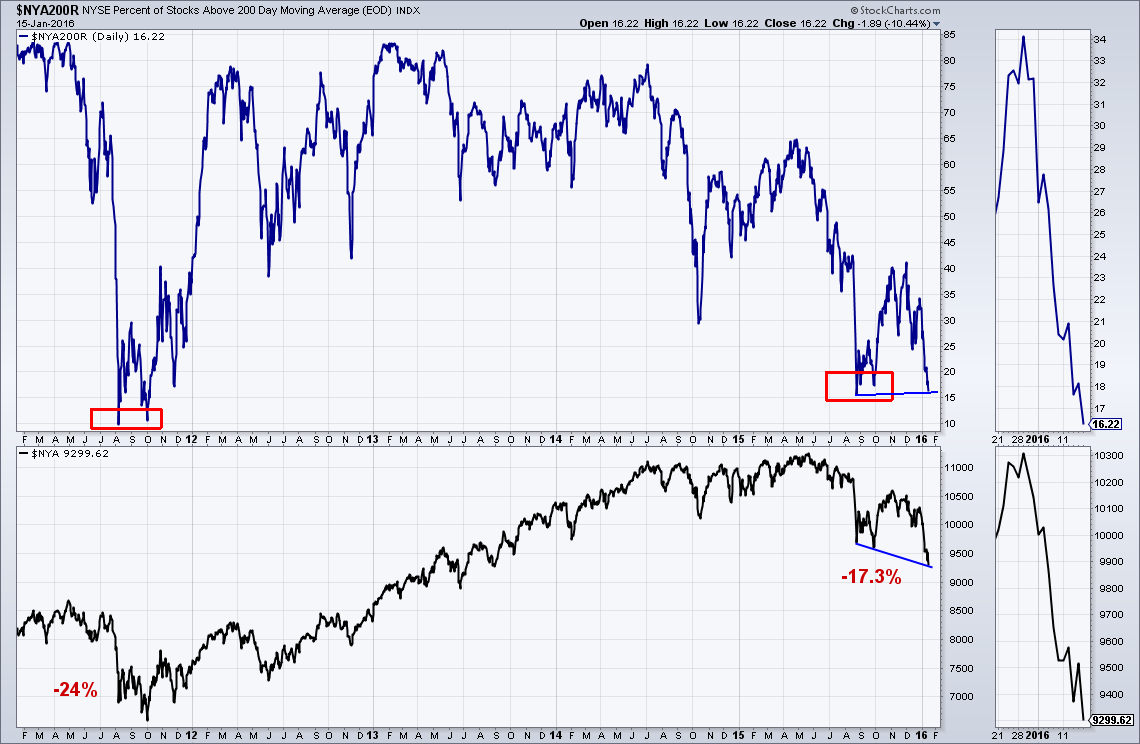
Market internals remain a tough read as some measures are confirming the new corrective lows in the NYSE and the S&P 500 while others may be putting in bullish divergences. For instance, the NYSE advance decline lines (total and common stock only) have dropped below the levels seen in August, confirming the price weakness. So far, the S&P 500 has not taken out its August low on a closing basis while the NYSE did. On the other hand, while the NYSE made a new low, the percentage of NYSE stocks above their 200-day averages (16%) remains above the levels seen in August, a potential bullish divergence. I will say this is pretty oversold, however this measure fell just below 10% during 2011. In addition, the number of new 52-week lows on the NYSE is not quite as high as August with the NYSE over 3% lower than the August market bottom.
From an overall sentiment standpoint, we are seeing big improvement, that is, fear is rising among many indicators. Smart money confidence toward stocks has risen to 71% from a recent low of 34%. Dumb money confidence toward stocks has fallen to 17% from a recent 65% reading. This is greatly improved from December, and is probably enough for a short-to intermediate-term rally to develop next week. I will note that during the past couple of market corrections, smart money confidence rose to 80%+ before a sustainable rally took place. This market sentiment data, as of the close Friday, is courtesy of SentimenTrader.
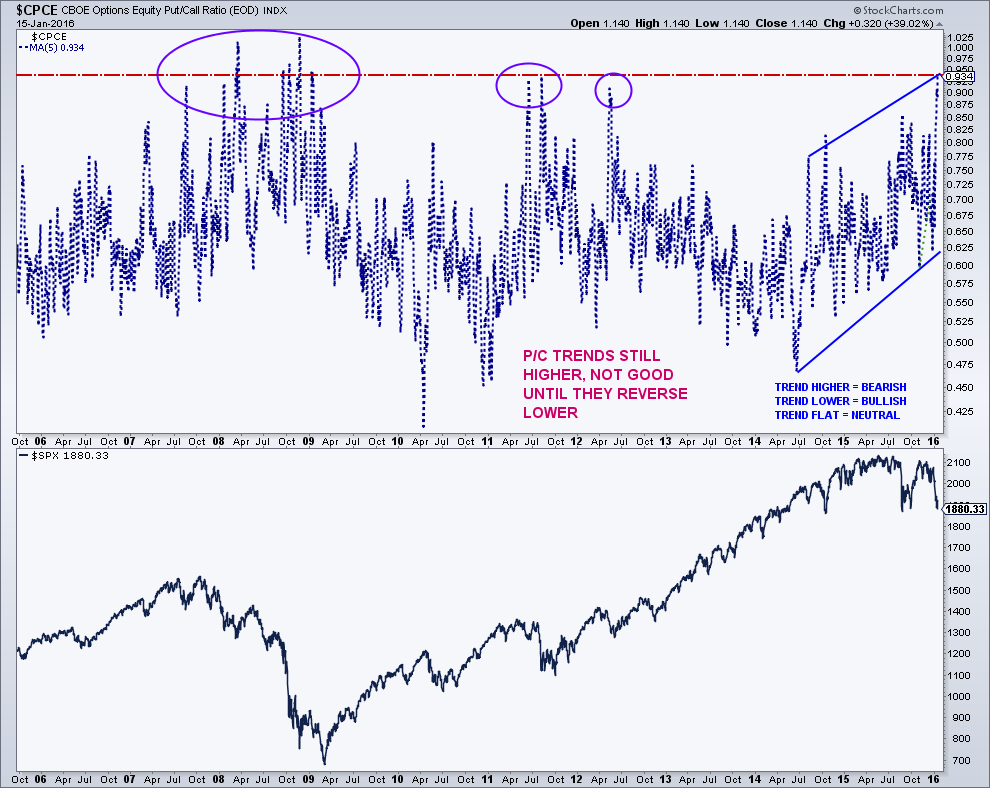
Delving into one of my favorite sentiment reads, the CBOE equity-only put/call ratio has spiked of late, and many times this represents some type of a market bottom. The 5-day average p/c hit 0.93 on Friday, the highest since the market bottom in 2011. However, the trend in put/call’s remains higher, a market warning for the intermediate-term. If this is a bear market, then this put/call will most likely go a lot higher, as it did in 2008 and 2009. During that bear, there were multiple daily readings above 1.15 with many 5-day readings well above 0.93.
Conclusion: Personally, I remain heavily tilted toward cash, but am doing some nibbling below 1,900 on the S&P 500 in anticipation of a potential, counter trend rally. You can contact me at arbetermark@gmail.com for premium newsletter inquiries.
Thanks for reading.
Twitter: @MarkArbeter
The author does not have a position in any mentioned securities at the time of publication. Any opinions expressed herein are solely those of the author, and do not in any way represent the views or opinions of any other person or entity.


: Showing Some Signs of Emerging Strength")
