“Most investors are primarily oriented toward return, how much they can make and pay little attention to risk, how much they can lose.” – Seth Klarman
Growing wealth occurs over a long time horizon, including many bullish and bearish market cycles. While making the most out of bull markets is important, it is equally important to avoid letting the inevitable bear markets reverse your progress.
Making this task much more difficult are extreme market environments and inane investor beliefs at such times. When markets are frothy and grossly overvalued, greed takes over, leading to lofty performance expectations and excessive risk stances. Equally tricky is buying when fear grips the markets.
In both extremes and all points in between, we must maintain investor Zen. The best way to accomplish such mindfulness and awareness of market surroundings is to understand the risks and rewards present in markets. Zen-like awareness allows us to run with the bulls and hide from the bears.
Measuring Risk
The price of every almost every asset represents the cost to receive cash flows in the future. With equities, for instance, we are buying future earnings.
When someone buys Apple stock, they are an owner of Apple. Like every company, public or private, Apple has options with what they can do with their earnings. The decision frequently boils down to paying them out as a dividend or reinvesting them into the company. At times they may hold cash, effectively delaying the decision.
The chart below compares the rolling ten-year average dividend yield and earnings yield for the S&P 500. As shown, half to two-thirds of earnings get paid out as dividends.
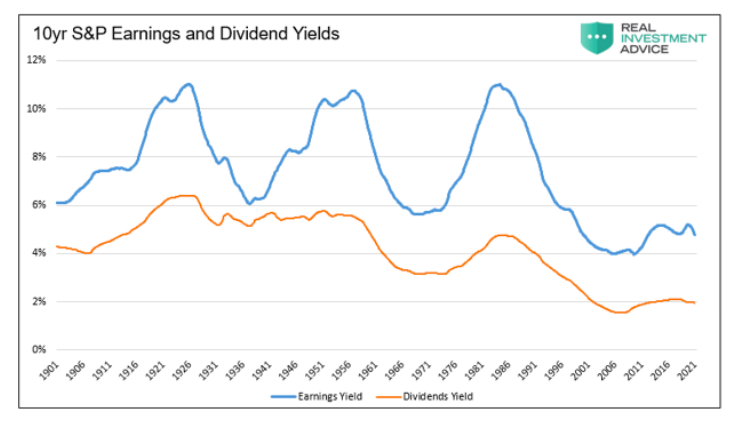
When determining the valuation for a company or index, we must understand that future earnings are what we are valuing. The reinvestment or dividend distribution decision is secondary.
Do Valuations Dictate Returns?
Short term price changes of stocks are based solely on liquidity, or the balance of buyers and sellers. Over longer periods, price changes become more dependent on valuations and less on supply and demand. The following scatter plots compare CAPE valuations to subsequent 10-year and 3-month returns to highlight this fact.
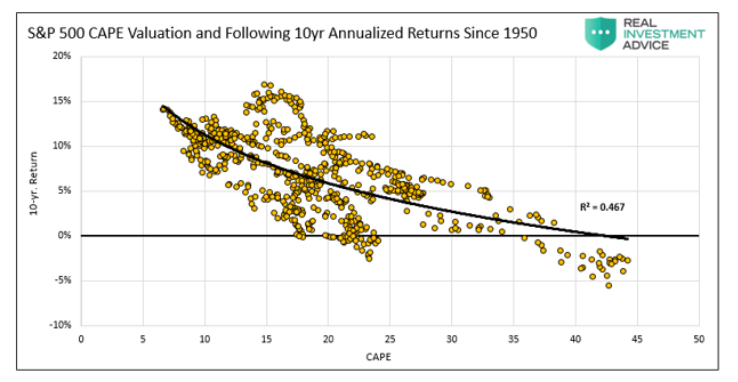
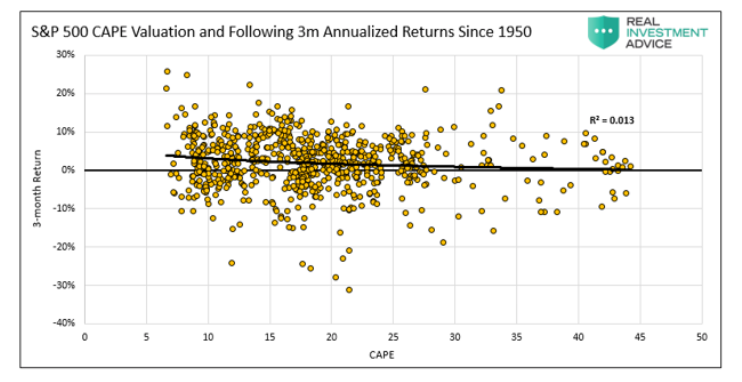
The correlation of ten-year forward returns and CAPE is statistically significant with an R-squared of .4803. In other words, valuation matters in the long run. Conversely, there is no correlation between quarterly returns and CAPE. The graph below further highlights valuations become a more critical measure of risk and reward over time.
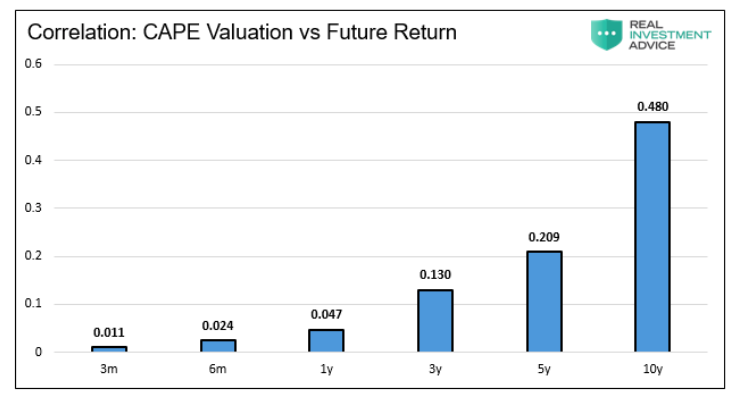
The use of valuations is often rebuked because they serve little purpose in daily trading. That is a fair statement. However, whether we are flipping stocks daily or holding for years, valuations provide an essential gauge of risk.
To be clear, just because we may evaluate a company using a long duration doesn’t mean we have to hold it for an extended period.
Earnings Trends and Expectations
GDP and corporate earnings trend linearly over long periods. That said, short-term earnings fluctuate wildly. It is these vacillations from the trend that makes equity valuation harder than it needs to be.
Since earnings are what we are buying, comparing historical earnings trends to market-implied earnings is a shrewd way to value a company or index. This method allows us to assess if we are paying more or less than what we should expect to receive?
Such a comparison serves well for stable, mature companies. However, it becomes a difficult task for companies whose earnings grow or shrink in a non-linear fashion.
Fortunately, many broad market indexes, such as the S&P 500, have linear earnings growth trends over long periods. This happens because the index’s large sample size and industry diversification reflect broad economic trends.
Implied Earnings
The price to earnings (P/E) ratio of an index or stock coupled with an assumed holding period, is all we need to calculate the market-implied future earnings growth rate. For instance, if the P/E is 20 and we assume a 40 year holding period, we expect earnings growth of 7.78%. Earnings, compounding at a 7.78% rate, entails shareholders will receive enough earnings to pay back their initial investment in 40 years. If 7.78% is an acceptable 40-year return compared to other assets, the stock or index is fairly valued.
The graph below compares five-year rolling S&P earnings growth rates and their trend (dotted blue line) with implied earnings growth rates (orange). More often than not in the last 30 years stock prices have higher implied earnings than the market has delivered.
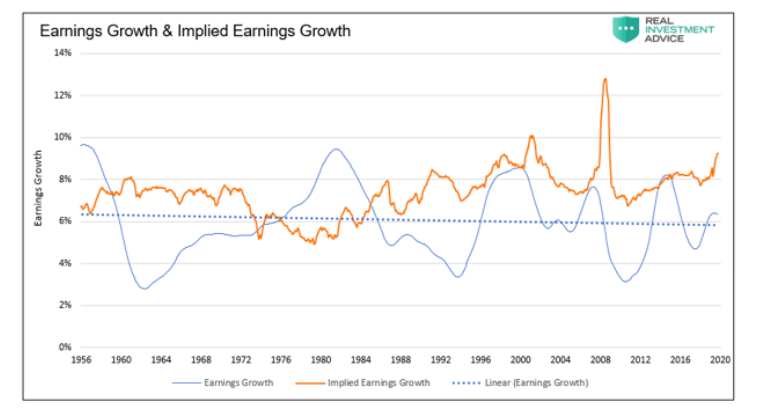
Current Valuations
Currently, the S&P 500 implies earnings growth of 9.25% over the next 40 years. The actual historical trend earnings growth is 5.85% and trending lower. The last time real earnings growth exceeded the current implied level (9.25%) was in the early 1980s.
Our use of a 40 year duration is subjective. Much of what we have read on the topic prefer shorter periods. The longer the period, the lower the implied growth. As such, we believe our assumption is conservative.
Understanding investors’ lofty expectations is the first step to understanding risk. The second step is to equate it to value and put it into context with prior periods.
The black line in the following graph quantifies how much the S&P 500 would change if implied earnings revert to trend earnings.
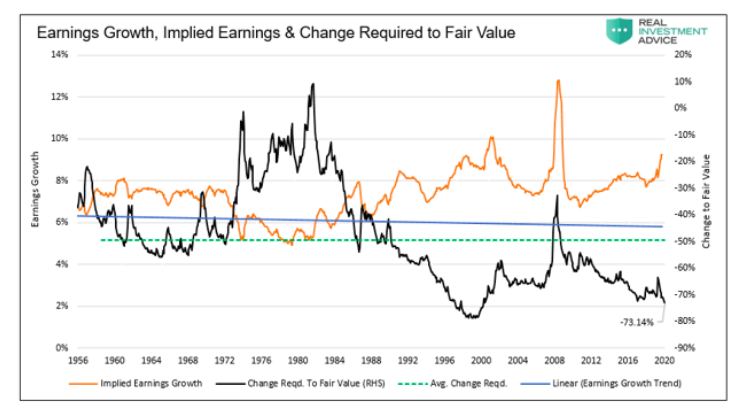
The S&P has to fall 73% for implied earnings to equal trend earnings growth. We admit the calculation may be exaggerated. As such, we think it wise to compare the current level versus those in the past. A return to the average change required (green dotted line) still involves a decline of nearly 50%. A 40% decline matches the average of the last 20 years. A drawdown of 40% is not farfetched considering the previous three major drawdowns, 2000, 2008, and 2020 had sell-offs in that neighborhood.
Stop, Sit and Breathe
You may frightfully read the paragraphs above and think about selling immediately. Stop, sit, breathe, and relax. Now is the time for investor Zen.
The market is grossly expensive, but as we stated valuations have poor predictive ability to help gauge what will happen in the next few weeks or months. Despite extreme valuations, we can ride the market higher with other greedy investors. However, unlike most investors, we are aware that the risk of significant losses is not minimal.
Quantifying downside risk allows us to have a plan in place to reduce or hedge risk when technical indicators and other signals alert us to potential changes.
When the market is more reasonably priced, we can be more relaxed, and our finger will not be tightly wound around the trigger. Today, however, valuations provide little cushion to be wrong.
Summary
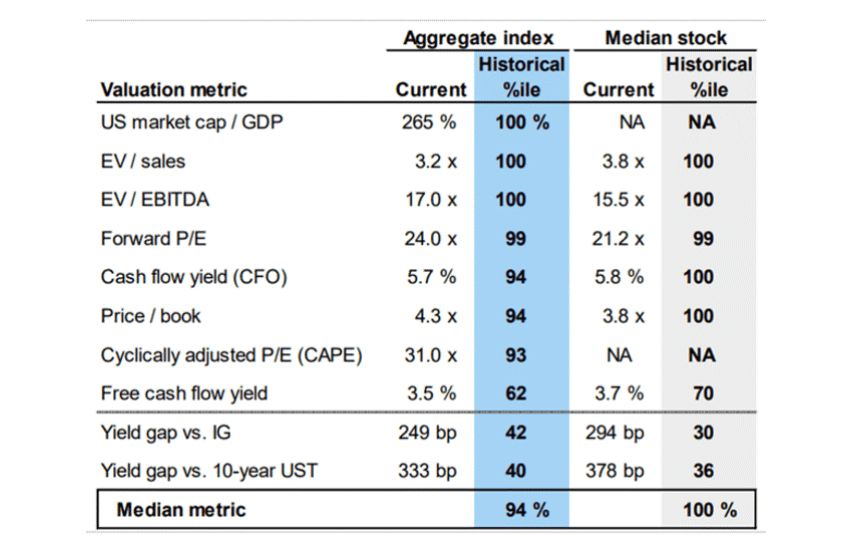
Stocks are extremely expensive. Regardless of whether you agree with our earnings model or not, drawdown risk is higher today than at almost any other time. The Goldman Sachs table below uses multiple valuation metrics and comes to the same conclusion.
In a recent article Bloomberg states: “The so-called Buffett Indicator. Tobin’s Q. The S&P 500’s forward P/E. These and others show the market at stretched levels, sometimes extremely so. Yet many market-watchers argue they can be ignored, because this time really is different. The rationale? Everything from Federal Reserve largesse to vaccines promising a quick recovery.”
If hope that this time is different is your risk management plan carry on. For the rest of us we advise having a strategy with actionable signals.
Find your inner investor Zen!
Twitter: @michaellebowitz
Any opinions expressed herein are solely those of the author, and do not in any way represent the views or opinions of any other person or entity.


 and Russell 2000 (IWM)")


