So far in 2021, the S&P 500 Index and the TSX Composite are both up nearly 25%. A truly remarkable year for equity markets that were fuelled by everything from fiscal spending, money “printing” or easy monetary policy, economic recovery, the retreat of a pandemic and a sprinkling of inflation.
Making this year even more remarkable is the breadth of the advance. This is NOT just Microsoft, Apple, and Shopify pushing their respective market cap-weighted indices higher. In fact, year to date, Microsoft is ranked 74th among the S&P 500 and Apple is way down the list at 314; Shopify is 56th out of the TSX’s 230 current index members.
In other words, this market advance is much broader than many of years past.
This is good news for investors because an index that goes up, driven by just a few names, is just not healthy in terms of the sustainability of those gains, and it can be very frustrating if you do not own those few select names. In 2020, the S&P 500 rose by 18%, but the top 10 contributors represented 70% of the market’s advance. Basically, if you didn’t own those large cap leaders last year, you either lost or at least didn’t feel nearly as happy. But 2021 is much more balanced. While the market is up 25%, less than 40% has come from the top 10 contributors.
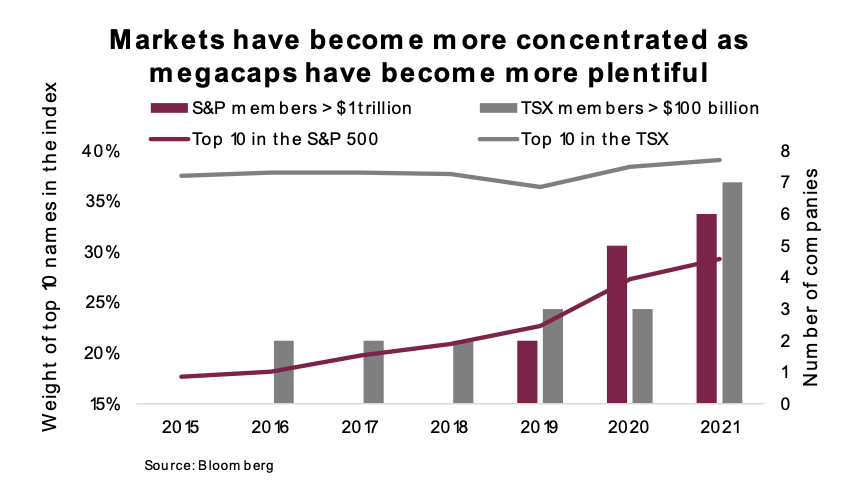
The S&P 500, TSX and most indices are market capitalization-weighted – the bigger the company’s market cap, the heavier its weight in the index. And given the price appreciation of many of the super mega caps in recent history, the relative weighting in most indices is historically concentrated within a few names. Currently, there are six companies with a market cap over $1 trillion in the U.S. In 2018, there were none. In Canada’s TSX, we have 7 companies over $100 billion, but there were only three in 2019. The markets have gone up, of course, but the concentration in the mega caps has increased even more so.
This trend is more evident in the U.S. market. Today, the top 10 S&P 500 members represent 29.3% of the index – up from 20% a couple years ago. The TSX has always been less diversified than the U.S. market and does suffer from a long history of high concentration. Today, the top 10 names comprise 39% of the index, up slightly over the past few years.
So, why should investors care? If the performance dispersion is narrow and concentrated in those mega cap names (e.g., 2020), simply owning the market cap-weighted index is likely the preferred strategy. If dispersion is broad, this is a better environment for either active or factor-based strategies. Of course, the active manager must pick more of the stronger-performing names, or the factors need to be the right ones for the market. However, there is a much greater chance of this in markets with high dispersion of returns versus a concentrated one. The odds get even greater if the high concentration names falter. Outperforming the Canadian market is much easier if the banks stumble; for the S&P 500, it’s tech.
In 2021, we have seen a rise in dispersion within the S&P 500. To measure, we track the percentage of index members that are outside +/- 15% of the index performance based on the trailing year. So, if the market is up 10%, our dispersion measure is the percentage of companies up over 25% or down more than -5%. The more companies on the tail of this distribution, the higher the dispersion. When dispersion is low, it’s harder for active management to outperform. Even if more winners are picked, or losers avoided, the magnitude of the benefit for the overall portfolio is less. Or simply put, dispersion is good for active management…
…and dispersion has been rising.
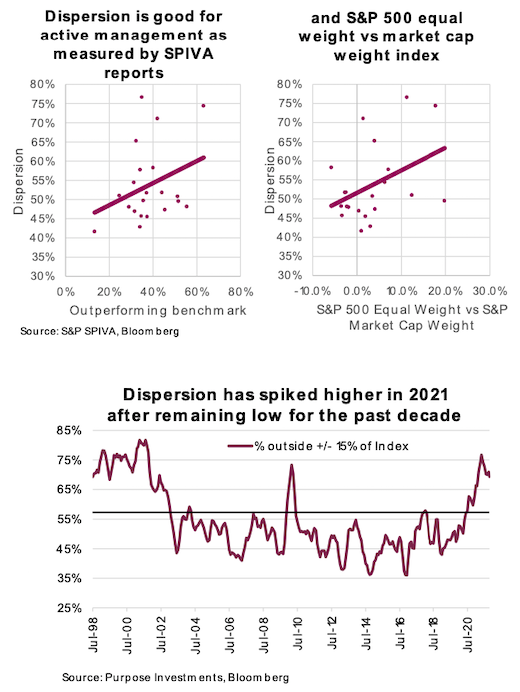
There are several factors contributing to greater dispersion. Rising yields and inflation tend to impact companies very differently; some win and some lose. This increases dispersion and the fundamentals of companies start to matter more, which are seeing headwinds as we navigate a changing world. We appear to be transitioning from a macro-driven market to one that is more micro, and that likely means higher dispersion.
Investment implications
Active versus passive is not a binary decision. Both have positive and negative characteristics from a portfolio construction perspective. Passive enjoys lower relative costs, albeit not to the same degree as years ago since active costs have come down. Active enjoys better risk management, especially when market cap-weighted indices are concentrated, such as they are these days. Usually folks just talk relative performance, with passive winning that debate in recent history. But this has come alongside increasing concentration in the index, which carries greater risk. Active and passive work best together, but sometimes more of one than the other, depending on the market environment and risks.
Since we believe index dispersion will remain elevated as we head into a potentially higher inflationary environment and the macro influence of central banks begins to recede, we currently have an active tilt within equity allocations. This tilt is likely to increase, given concentration risks in capitalization-weighted indices and a market that appears to be increasingly more micro-driven than macro.
Source: Charts are sourced to Bloomberg L.P., Purpose Investments Inc., and Richardson Wealth unless otherwise noted.
Twitter: @ConnectedWealth
Any opinions expressed herein are solely those of the authors, and do not in any way represent the views or opinions of any other person or entity.

 Rolling Over At Key Fibonacci Level?")


