As the market continues to operate in correction mode, even large cap favorites like Facebook stock (FB) are pulling back. This isn’t unexpected though.
The last time I blogged about Facebook stock (FB) was November 12. And I was looking for a top.
In that Facebook chart update, I was looking for 108-110 to hold as a near-term top:
With Facebook stock price touching up near $110 yesterday, the sell pattern levels that have been on my radar for a while have been hit.
I expect Facebook stock price to seek the $88 level. Note though that there isn’t any clearly defined buy pattern as of yet. So stand aside or remain extremely disciplined here. There is still a good chance that Facebook has further to fall, perhaps to the $70 area.
As I mentioned in my last post on Facebook stock, the long-term chart looks bullish. But it’s all about finding good risk-reward entry points… and for me, buy patterns.
From a RISK perspective, this IS a very bullish chart but entering at current levels is too adverse for me. I’ll pass and look for a harmonic, balanced and square root based correction to get long.
Below is an updated chart for Facebook. I’ll try to provide another update as the pattern becomes clearer.
Facebook Stock Chart – Weekly
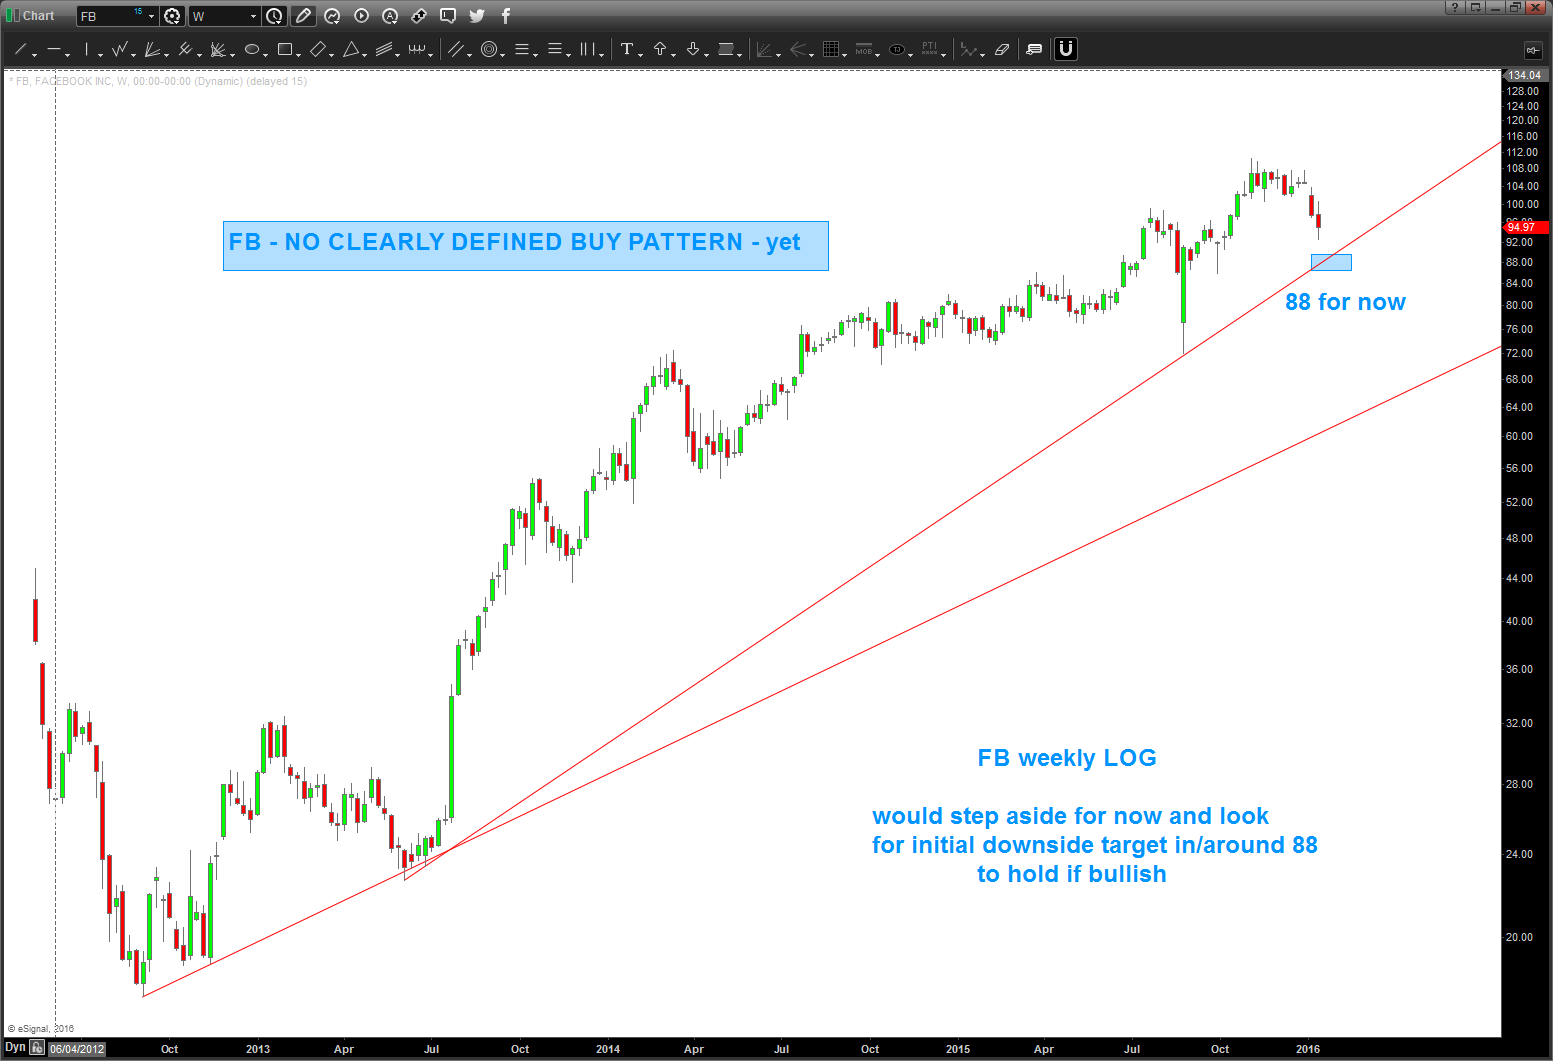
There isn’t a clearly defined buy pattern as of yet for Facebook. So, as I mentioned, probably best to stand aside and remain patient.
Twitter: @BartsCharts
Author does not have a position in mentioned securities at the time of publication. Any opinions expressed herein are solely those of the author, and do not in any way represent the views or opinions of any other person or entity.

: Worrisome to Broader Market?")
