Facebook stock (FB) is, quite frankly, a powerhouse. That’s what I believe…
But, in this game of investing, I’ve come to realize it’s not a profitable endeavor to invest in what you believe. It’s very powerful to invest in what you SEE.
So what am I seeing in $FB right now? Well, Facebook stock is nearing an important price target based on chart price patterns and math:
- AB=CD in price and time.
- BUTTERFLY SELL pattern.
- Bearish Divergence
- Sell patterns hit, but an upper price target of 116’ish is out there.
For further reference, feel free to read my prior work on Facebook (FB): Gonna Watch 108 and 113 on FB (July) and Facebook Post Q3 Earnings Look (November).
Below is one of the Facebook charts that I shared in my recent Q3 earnings post:
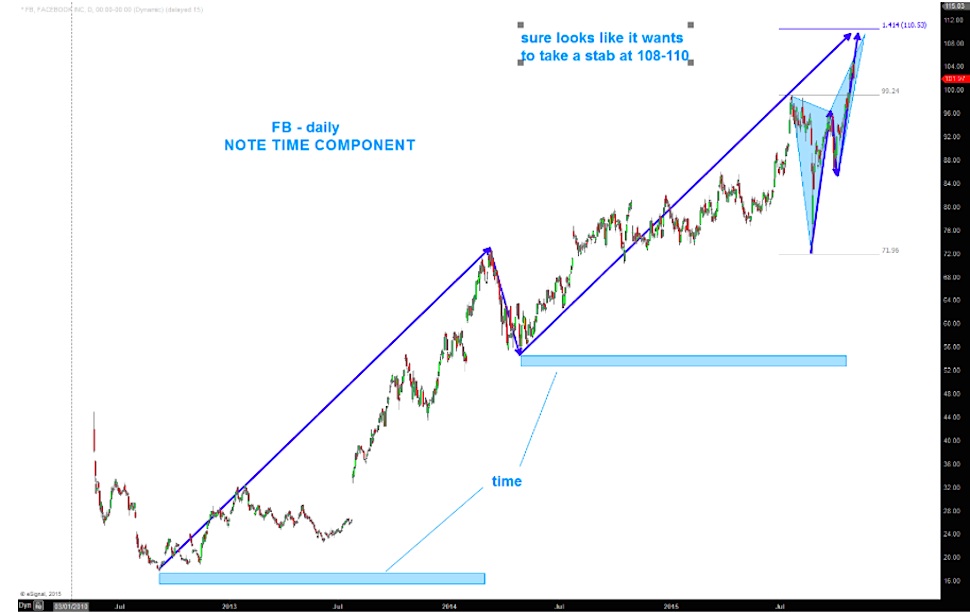
With Facebook stock price touching up near $110 yesterday, the sell pattern levels that have been on my radar for a while have been hit.
So, IF this is your first time reading my blogs OR you are a follower THEN you realize it’s time for the IF-THEN PATTERN play:
- IF $FB finds resistance in this 108-113 price area THEN expect a potentially ‘big’ correction into the low 70’s. (Do the math, that’s a 30 percent correction).
- IF $FB blows thru these targets with strength THEN WATCH $116!
From a RISK perspective, this IS a very bullish chart but entering at current levels is too adverse for me. I’ll pass and look for a harmonic, balanced and square root based correction to get long. So let’s try to figure out where that might be.
continue reading on the next page…

: Showing Some Signs of Emerging Strength")
