Tuesday, many commodity ETFs gapped lower while the major indices gapped up.
Additionally, the Russell 2000 (IWM) finally cleared its pivotal price level at $209.
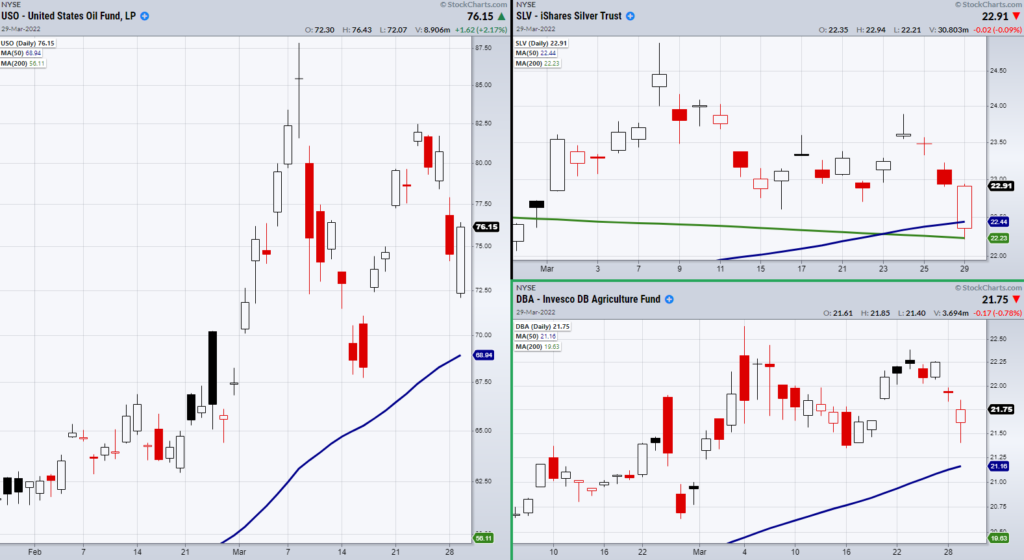
However, while the indices made a nice close on the day, ETFs such as Oil (USO), Agricultural Fund (DBA), and Silver (SLV) regained a large amount of their gap or more by the close.
Commodities are most often seen as lower risk safety plays compared to securities/stocks.
With that said, Tuesday shows that even with the stock market pushing higher, the knee-jerk reaction in commodities reversed by the close.
This shows that we have traders willing to take risk in equites along with many who believe the market still has weakness.
With inflation increasing we have chosen the middle standpoint.
We don’t see a large bull market forming, but we also don’t see a collapse on the way.
This type of environment bodes well for commodities, which ties back into the stagflation/rangebound market scenario where growth continues as we emerge from the pandemic, but inflation pulls on the rains of growth creating a back-and-forth battle.
With that said, if the above symbols hold their recent lows, this could be an opportunity to buy commodities.
One thing to be careful of is while both commodities and equities are showing strength on Tuesday, I doubt both will be able to sustain an upward trend going forward.
Stock Market ETFs Trading Analysis and Summary”
S&P 500 (SPY) 447 is price support.
Russell 2000 (IWM) 209 needs to hold as new price support.
Dow Jones Industrials (DIA) 350 is price support to hold.
Nasdaq (QQQ) 368 is the 200-day moving average (support).
KRE (Regional Banks) Watching for a second close over the 50-day moving average at 72.30
SMH (Semiconductors) 268 is price support.
IYT (Transportation) 270 is price support.
IBB (Biotechnology) Needs to hold the 50-day moving average at 127.79
XRT (Retail) 80 is key price level to hold.
Twitter: @marketminute
The author may have a position in mentioned securities at the time of publication. Any opinions expressed herein are solely those of the author and do not represent the views or opinions of any other person or entity.

: Worrisome to Broader Market?")
