Any Other Examples With A Low VIX?
Yes, as shown in the chart below, 2004-2007 also featured a low VIX (similar to 2016 levels) and significant gains in the S&P 500.
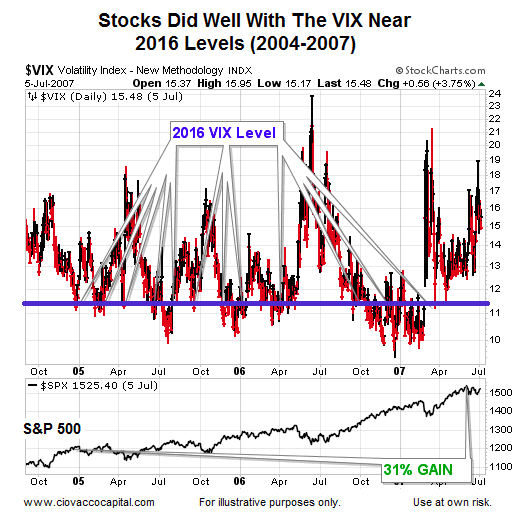
How is this VIX analysis helpful? It simply tells us a low VIX is one piece of evidence and taken in isolation, it is not necessarily a showstopper for stocks in 2017.
Will The Strong Dollar Harm Stocks In 2017?
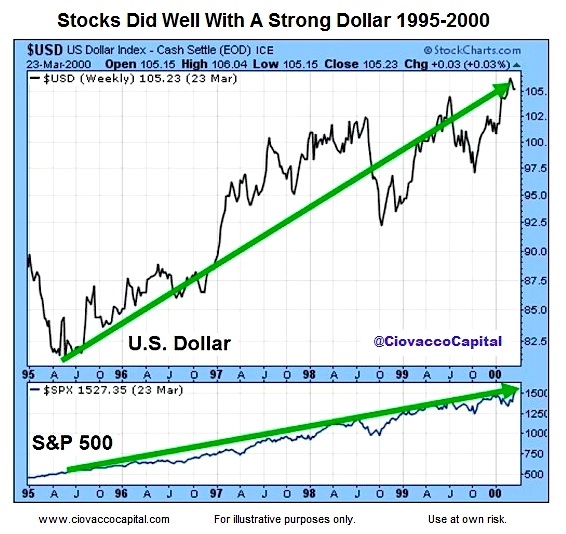
It may be the case. However, the historical VIX example above featured a 40% pop in the S&P 500 that took place in 1995 and 1996, a period that also featured a strong U.S. dollar (see chart below).
More historical references to a strong U.S. dollar and stocks can be found in a November 25 analysis.
2016 Is Different Than 1994
Yes, 2016 is significantly different than 1994. However, 2016 is also different from every other year in history, including 2014 and 2015; years that featured poor S&P 500 performance following low VIX readings.
Calendar years 2014 and 2015 were dominated by central banks (monetary policy). Growth was more important to the markets in 1995-1996 relative to central banks. A similar shift may be taking place in late 2016. Earlier in 2016, central banks were the market’s primary focus. With growth and earnings expectations picking up heading into 2017, central banks are playing second fiddle to the economy. From a recent Wall Street Journal op-ed by Fed president Neel Kashkari:
“If markets are right and that growth materializes, the last thing we will want is monetary policy on autopilot that could quash the recovery because it is unable to recognize if productivity and potential output are rising and the economy has room to run. A high-growth, investment-driven economy will automatically put monetary policy on the back burner, where it should be.”
Any Other Similarities To 1994?
A rarely covered technical indicator, ADX, provides some additional insight into similarities and differences between 2016 and 1982/1994/1999.
Thanks for reading.
Twitter: @CiovaccoCapital
The author or his clients may hold positions in mentioned securities at the time of publication. Any opinions expressed herein are solely those of the author, and do not in any way represent the views or opinions of any other person or entity.
: Creating Bullish Divergence?")


 and Semiconductors (SMH): Concerning Price Pattern?")


