What Does History Tell Us About A Low VIX, Complacency, And Stock Market Risk?
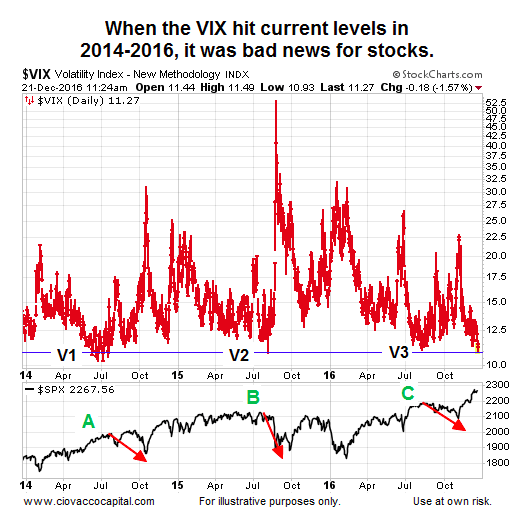
Given the S&P 500’s (INDEXSP:.INX) weak performance (see A, B, and C in chart above) following similar low readings on the VIX “fear index”, it is prudent to ask, how concerned should we be heading into 2017 with the VIX Volatility Index (INDEXCBOE:VIX) sitting near 11?
Possible concerns were summarized in a recent CNBC article:
“The so-called fear index shows that investors are feeling content right now, but volatility could be coming as markets roll into 2017… Typically, a low VIX signals a market that’s comfortable with current levels. But as 2016 winds down, some analysts say the low levels in the VIX and improved outlook on growth potentially set the market up for disappointment — and greater volatility ahead.”
What Happens If We Look Further Back In History?
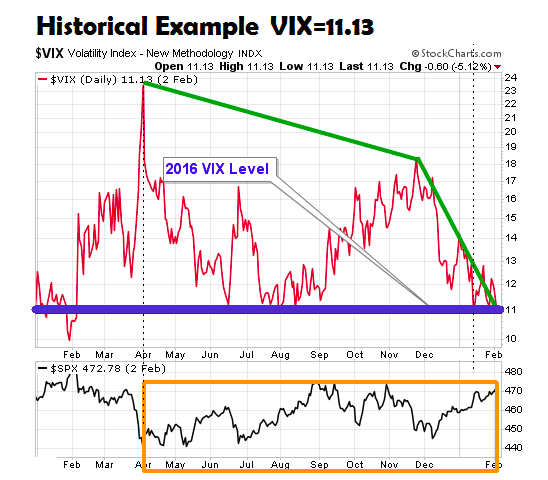
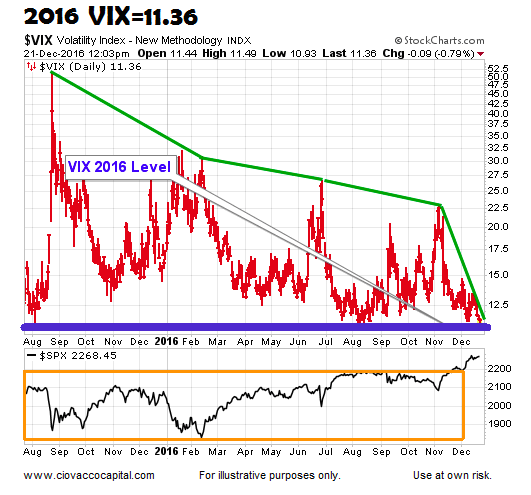
To remove our historical bias, the dates have been removed from the first chart below. The second chart is December 2016. Notice in both cases, the VIX drops from much higher levels (green lines) to roughly 11, while the S&P 500 is consolidating (orange boxes). Price action and the VIX in both cases show higher levels of expected volatility (“fear”) and an indecisive market (consolidation). In both cases as confidence started to return, the S&P 500 moved back near the top of the orange box as the VIX dropped (“lower levels of fear”).
What Happened Next In The Historical Case?
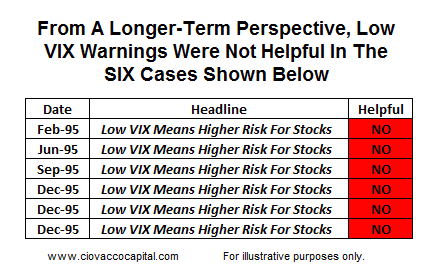
The chart below shows what happened over the next year; the VIX rose from low levels, but returned back to low levels (near the present day reading of 11) several times (see 1, 2, 3, 4, 5, and 6 below). Even with the VIX hovering near 11 on seven separate occasions, the S&P 500 posted a gain of over 40% in the same period (see lower portion of chart).
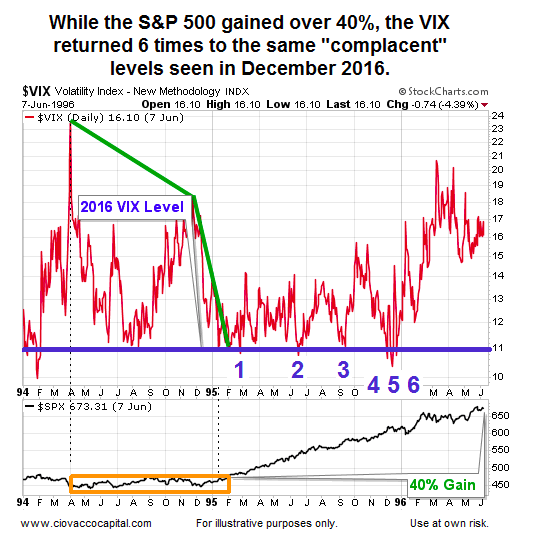
Given the VIX rose from 11 to higher levels and then dropped back near 11 six additional times, articles that were written based on “a low VIX means stocks are in trouble” theory were not particularly helpful to longer-term investors. Timeframes matter, meaning the VIX may have been helpful to short-term traders in some cases.
continue reading this post on the next page…
: Showing Some Signs of Emerging Strength")


: Showing Some Signs of Emerging Strength")