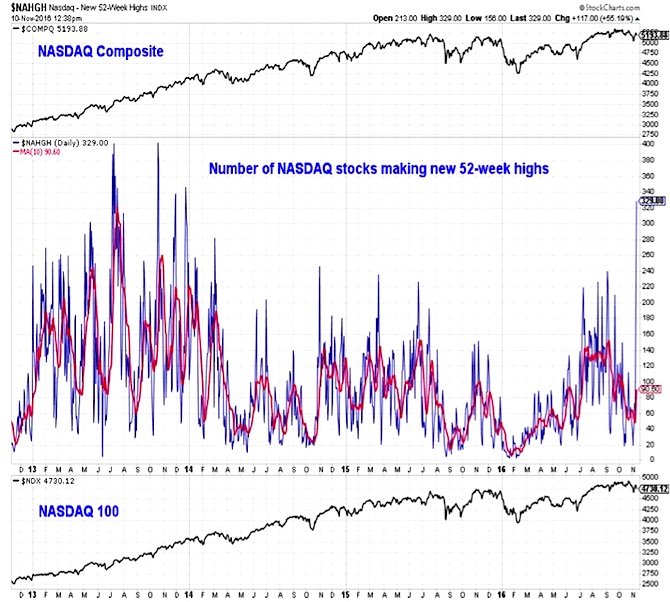
In this spot two weeks ago we discussed how the NASDAQ 100 was moving to new highs, while a narrowing percentage of the stocks on the NASDAQ were even trading above their 50-day averages. Now, the reverse seems to be true.
The NASDAQ 100 and the NASDAQ composite have been weighed down by the mega-cap FANG stocks, while the number of stocks making new 52-week highs has surged to its highest level since 2013. Alternatively, the number of stocks making new lows has plummeted as the broad market has shown signs of changing character yet again.
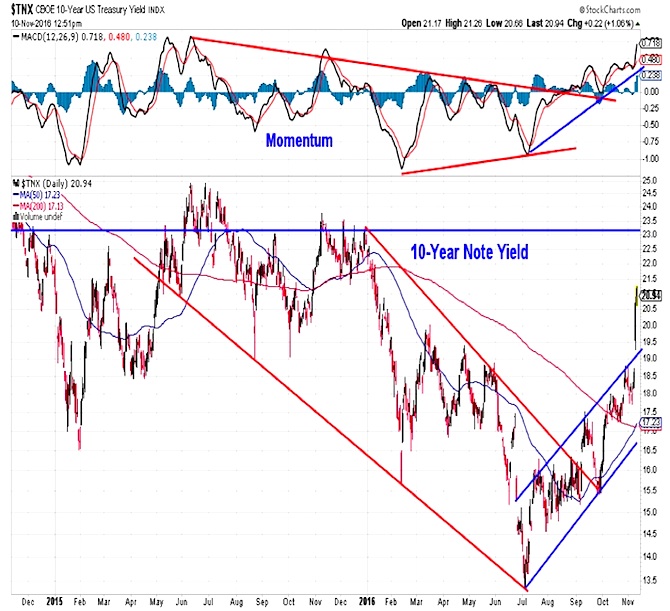
Treasury Bonds
Bond yields have broken out to the upside. While perhaps over-extended on a short-term basis, this builds on the yield rally that has emerged in the second half of 2016. Remarkably enough, however, so far this has only undone most of the collapse in yields that was seen over the course of the first half of the year. While long-term down-trends in yields are being broken, the yield on the 10-year T-Note is still below where it began 2016 (2.3%).
The US Dollar (CURRENCY:USD) remains largely within the range that has been in place for the past 2 years. While there is some evidence that it is poised to test the upper end of the range, it is a little bit difficult to argue that the trend that emerged over the second half of 2014 is re-asserting itself. The consolidation has lasted longer than the initial up-trend. It is also interesting that while the dollar is moving higher on a price and momentum basis, the year-over-year change continues to move lower. In each of the past two years, the dollar has rallied into year-end. If strength persists in early 2017, that might signal a new up-trend is emerging.

Prior to Donald Trump’s election as president, Financials (on a relative basis) had been generally following the path of bond yields – moving slowly, but steadily higher over the course of the second half of 2016. This week, however, the sector has exploded higher on both an absolute and relative basis. Momentum was already improving for Financials (in contrast, this week’s rally in Health Care remains somewhat counter-trend). While perhaps overdone on the upside, the strength in Financials seems to have bullish ramifications for the stock market overall.

Thanks for reading.
Twitter: @WillieDelwiche
Any opinions expressed herein are solely those of the author, and do not in any way represent the views or opinions of any other person or entity.


: Showing Some Signs of Emerging Strength")
