Stock Market Outlook & Technical Review For November 11
Here’s a look at some key stock market indicators and emerging themes that I am watching in my latest S&P 500 (INDEXSP:.INX) Review and Weekly Stock Market Outlook:
Index-Level Trends Turning More Bullish – The stock market roller coaster of the past two weeks has been guided by external events, and this has helped obscure some positive index-level trend developments. When looking across a bevy of broad domestic stock market indexes, we see the most trading above their 50-day averages since the end of September. The Dow Transports () have made a new 52-week high, and the Dow Jones Industrial Average (INDEXDJX:.DJI) have moved to a new all-time high. Add in new highs from Financials and Copper and a relatively bullish message begins to emerge.
Breadth Pointing To A Change In Character – Two weeks ago, the NASDAQ 100 was making a new all-time high while the average stock was lagging. Now we see breadth on the NASDAQ leading the indexes. The number of issues making new highs has surged to its highest level in three years as the mega-caps have stumbled.
Bond Yields Rising – Bond yields have been climbing off of their post-Brexit lows, but the election of Donald Trump as president seems to have accelerated this move. While his election is expected by many to also be a tailwind for the dollar, evidence of an upside breakout there is still lacking.
Stock Market Indicators
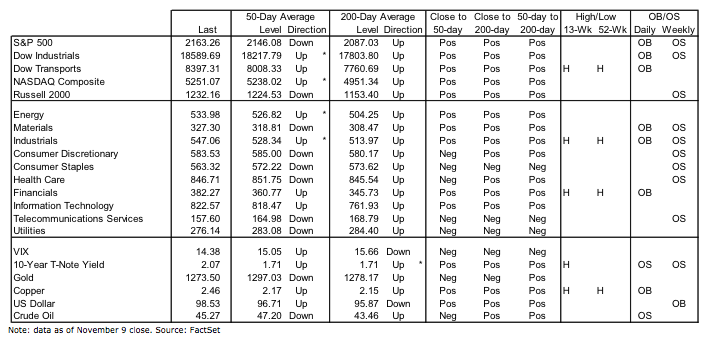
Major Stock Market Indices
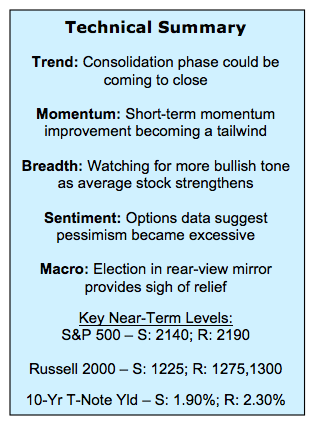
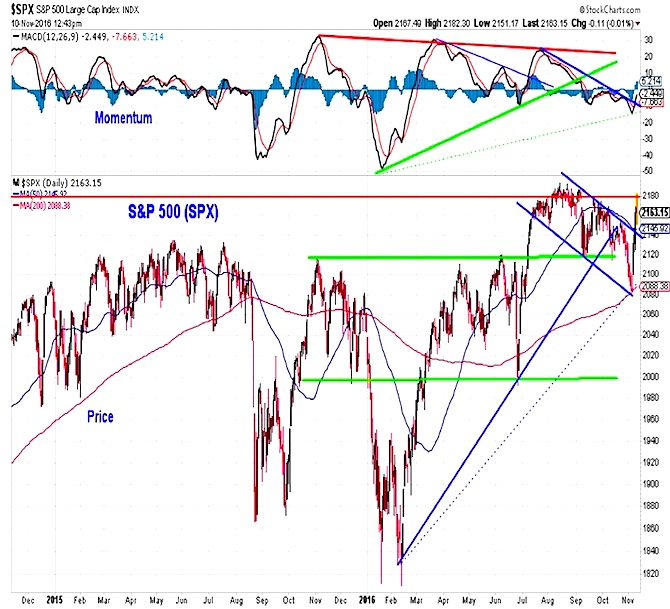
The initial leg of this week’s rally on the S&P 500 appeared to be a reaction to an oversold condition that left the index at support near the 200-day average. The gains that have emerged later in the week have moved the index through down-trend resistance (and the 50-day average) near 2145. Momentum has turned tentatively higher and the consolidation phase that has been seen since the August peak may well have run its course.
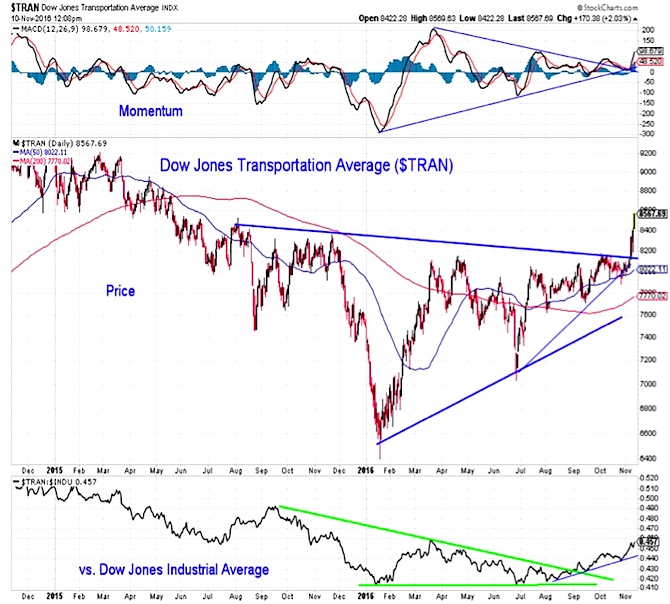
The rally is finding leadership where it would be expected if this is no longer just an oversold bounce. Small-caps have fully recouped their October declines and are closing in on a new relative high (for the year) versus large-caps. We have also seen the Dow Transports break out to the upside. While the price and momentum gains have been strong, most impressive may be that the Transports are gaining strength against the Industrials, which themselves have move sharply higher (and are at a new all-time high).
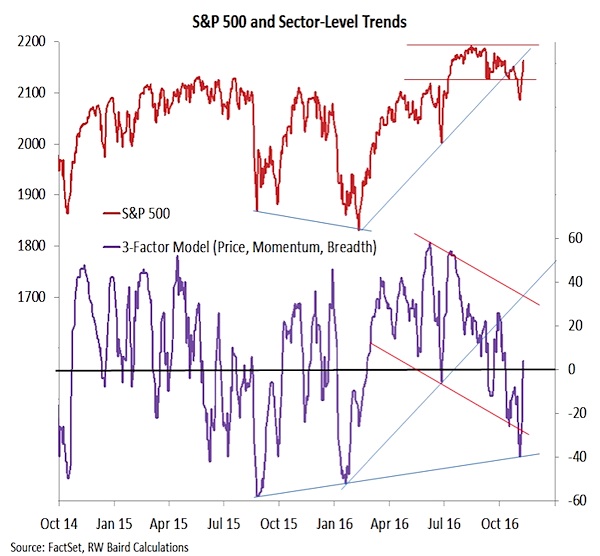
Evidence that the move seen at the index-level is sustainable would come from improved breadth readings. Breadth lost a step over the course of the summer and last week we downgraded it to neutral. Now however, there is evidence that it too may have gotten oversold and we are watching for the emergence of positive breadth divergences. Our sector-level trend indicator is moving in a positive direction after what could have been a false break-down. The down-trend pattern that has emerged in this indicator since peaking in the second quarter, however, remains intact, so returning breadth to bullish may be premature.
continue reading on the next page…

: Showing Some Signs of Emerging Strength")
