Here’s a look at some key stock market indicators, charts, and themes that we are watching.
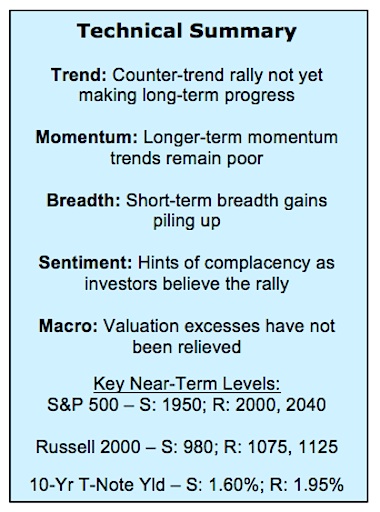
This Week’s Stock Market Outlook:
Keeping the Rally in Context – The S&P 500 has rallied through 1950 but faces additional resistance above 2000. While the near-term trends have improved, there is little evidence of shift in the longer-term price and momentum trends. We’ve not seen the types of divergences that would typically signal a lasting stock market low is in place.
Broad Market Perspectives – Shorter-term market breadth indicators have turned more constructive and are helping fuel the rally in stocks toward resistance, but the longer-term market breadth data continues to argue for caution. As a caveat, short-term market breadth improved in Q4 2015, but the longer-term measures never provided confirmation.
Sentiment Looking Less Skeptical – Investors have been slow to embrace the rally off of the lows, but that could be changing. Demand for put options is falling, the VIX is at its lowest level of the year, and active investment managers have put cash back to work. Investor sentiment is not yet problematic but it is moving in the direction of optimism and complacency.
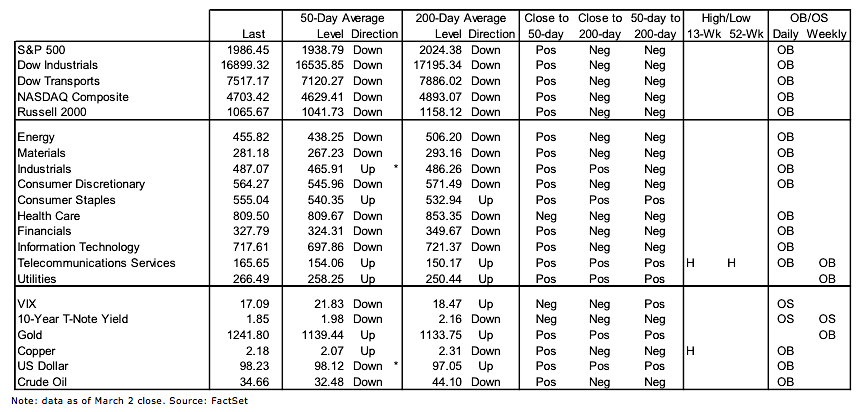
Stock Market Indicators – Indices & Sectors (click to enlarge)
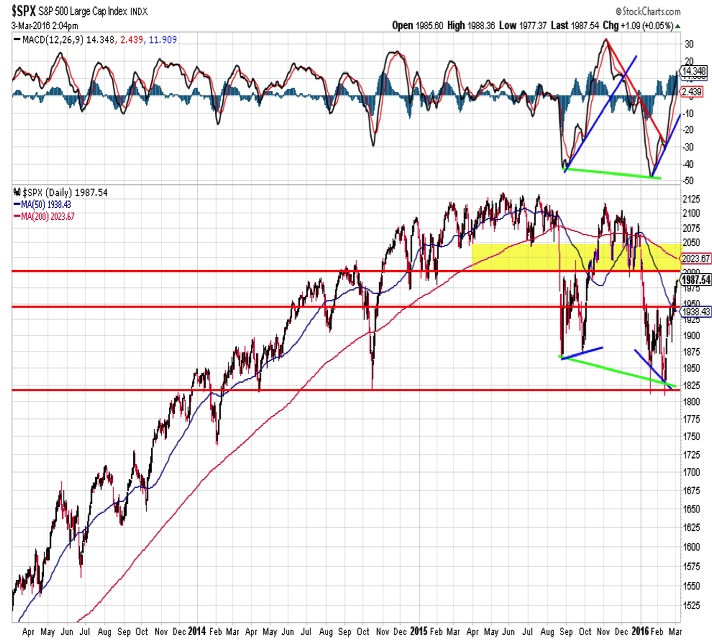
S&P 500 Index
Daily momentum continues to move higher for the S&P 500, helping sustain the price gains seen off of the February lows. With 1950 in the rear-view mirror, the S&P 500 now appears set to challenge 2000. More substantial (and perhaps more important) resistance builds near the 200-day average (2030). A move above the 12/31/15 close (2044) is not out of the realm of possibility and could provide a compelling cover-story if the longer-term trends re-assert themselves.
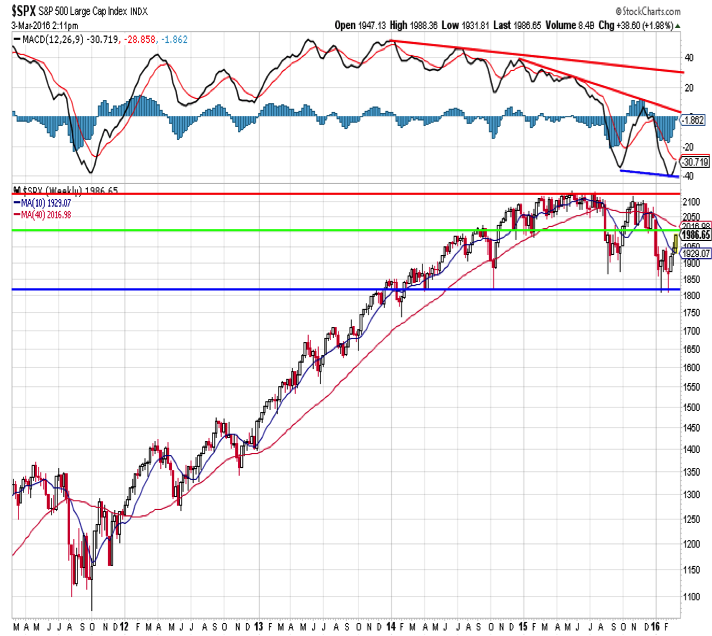
From a longer-term perspective, price trends continue to move lower and we have not seen a positive momentum divergence on the weekly chart. This increases the likelihood that after the initial rally off of the February lows runs its course stocks could be in for a substantial re-test.
Market Breadth Indicators
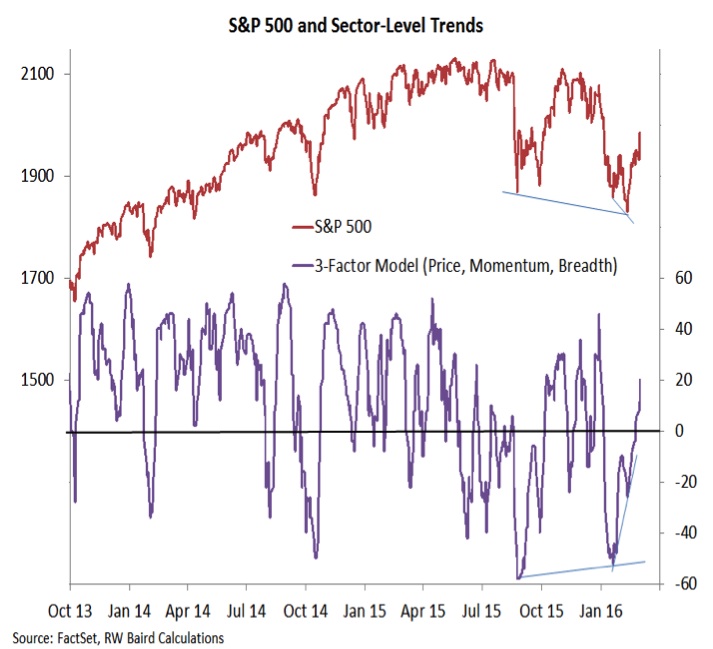
Similar to the price perspectives, short-term market breadth indicators have seen substantial improvement while the longer-term indicators argue for a more cautious approach to our stock market outlook. Our sector-level trend indicator offered a positive divergence in February and has continued to move higher with the price rally. We saw a similar situation coming off of the 2015 stock market lows.
continue reading on the next page…


