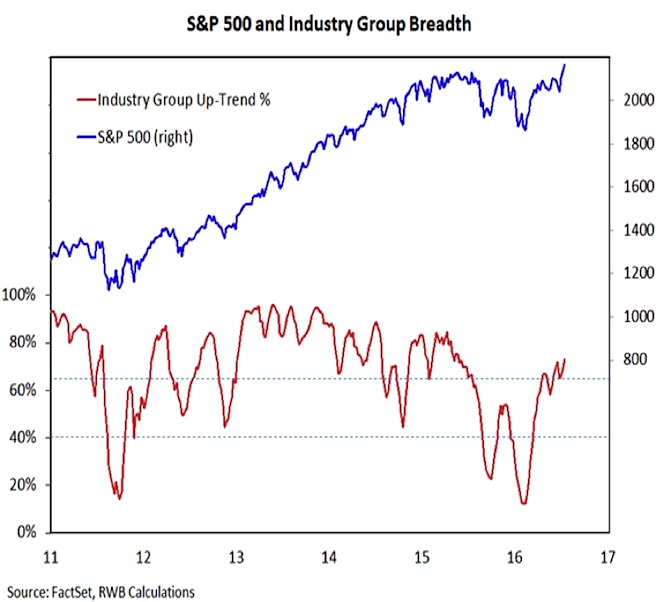
Market Breadth
With the strong tailwind being provided by both breadth and momentum, we are likely going to need more excessive levels of optimism to raise a red flag from a sentiment perspective. Our industry group trend indicator continues to move higher (at an elevated level) and the new high list for the NYSE and NASDAQ is expanding. The 10-day trend in net new highs (new highs less new lows) is at its highest level since January 2014. This bullish support was not available from the broad market when optimism reached excessive levels at various times over the past 18 months.
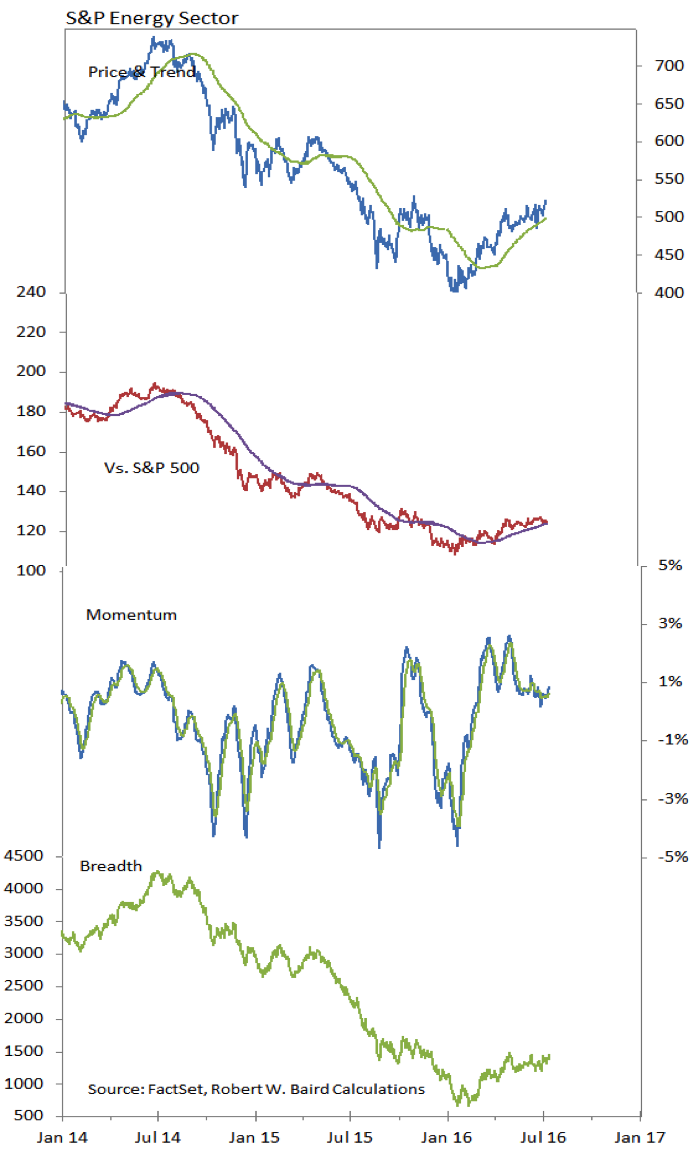
Energy Sector
Returning to themes from the Tactical Call, our relative strength rankings point to Energy sector leadership in the third quarter. This has already started to emerge, with the sector making important breadth and price (absolute and relative) lows earlier this year. Now modest up-trends are emerging and momentum remains relatively robust. The ratio between the energy sector and the utilities sector is at an important decision point, and the trend could be poised to tilt in favor of Energy for the first time in two years.
Thanks for reading.
Twitter: @WillieDelwiche
Any opinions expressed herein are solely those of the author, and do not in any way represent the views or opinions of any other person or entity.

: Showing Some Signs of Emerging Strength")
