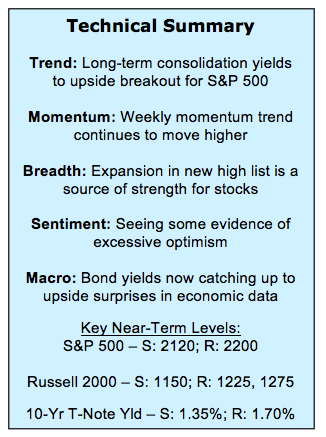
Weekly Stock Market Outlook & Technical Review (July 15)
Here’s a look at some key stock market indicators and emerging themes that we are watching:
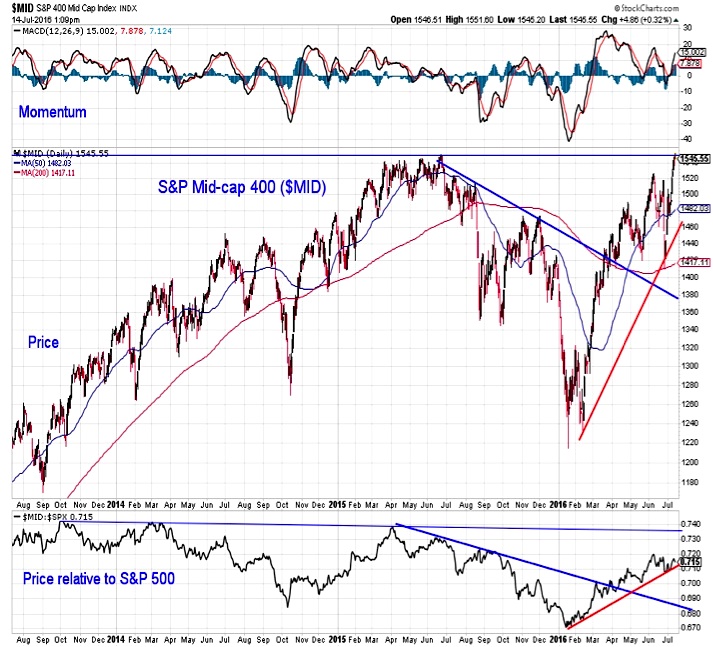
Relative Trends Point To Leadership From U.S. and Mid-Caps – U.S. stocks increasingly find themselves making new highs, but international indexes have had a tougher time the past year and a half. Among domestic indexes, the S&P 500 Index (INDEXSP:.INX), and in particular the S&P 400 Index (mid-caps) have been leaders so far in 2016. Improving market breadth could keep that trend intact as we move through the second half of the year.
Gold Rally Stalls and Bond Yields Move Higher – Excessive optimism can be seen for both Gold (NYSEARCA:GLD) and bonds, which could limit gains in both assets in the near term. This could mean that gold prices are vulnerable to a pullback and bond yields might continue to drift higher.
Strong Breadth Offsets Up-Tick In Optimism – We are also starting to see some evidence of optimism in stocks (in fairness, this week’s 31-point jump in the NAAIM index is more than just an uptick). Composite investor sentiment indicators are just barely seeing excessive optimism. The strong momentum and market breadth that is now present for U.S. stocks could mean there is room for optimism to move further into the excessive zone.
Stock Market Indicators – Indices & Sectors (click to enlarge)
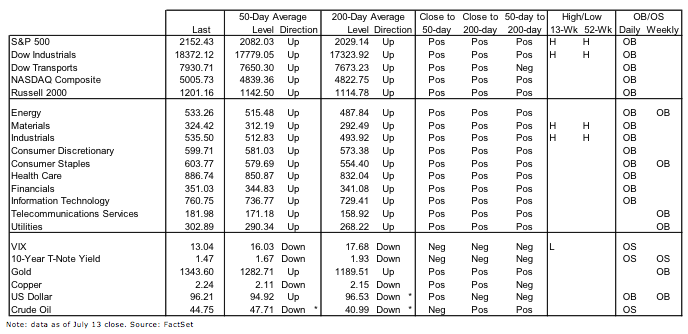
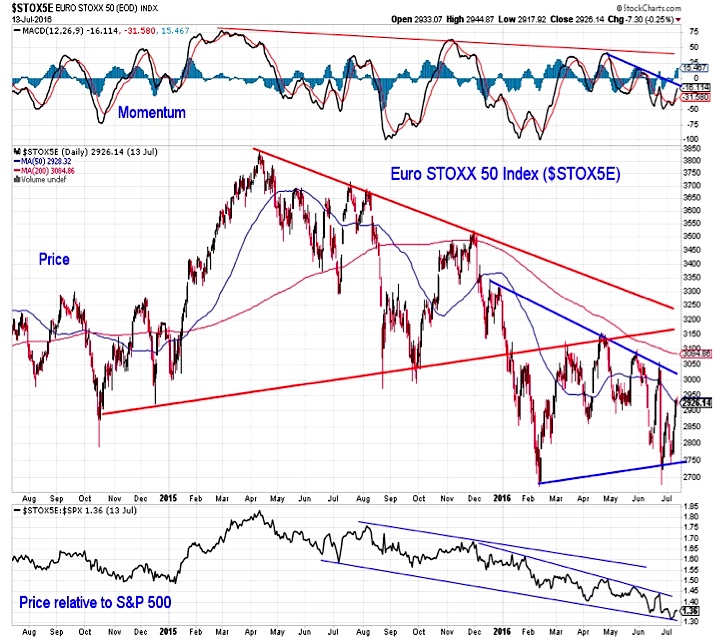
Global Equity Markets
We published our Tactical Call for the third quarter this week (available here), and wanted to provide visual color in this week’s stock market outlook for some of the trends we are looking at.
Not only has the U.S. been strong on an absolute and relative basis, but we have seen particular weakness out of Europe. Europe has been in a down-trend relative to the U.S. for most of the past 18 months. But it has been in an absolute down-trend as well, with price making a series of lower lows and lower highs. The S&P 500 Index has rallied off of the post-Brexit lows to make new all-time highs, while Europe has yet to surpass the levels seen in mid-June.
In the tactical call, we suggest tilting toward mid-caps due to the mixed evidence supporting small-caps and large-caps. But this is not just an indecisive equivocation. Mid-caps have been stronger than large-caps or small-caps for much of 2016. After posting lower highs and lower lows (on both an absolute and relative basis) in 2015, mid-caps have spent much of this year making higher highs and higher lows on both an absolute and relative basis. With market breadth remaining strong, this pattern could continue in the second half. Note that mid-caps are joining large-caps in making new all-time highs.
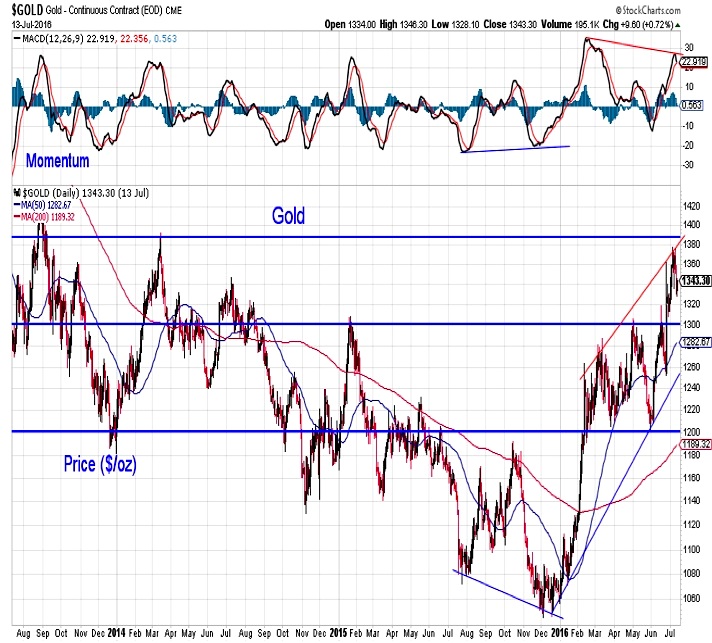
Gold
Gold prices has also suffered from a negative price and momentum divergence. Interestingly, the late-2015 lows in gold came with a positive momentum divergence. which helped fuel the rally that has been seen in 2016. With optimism in gold also excessive and bond yields starting to rise, gold could be poised to test 1300, but it would take a break of 1250 to call into question the 2016 rally.
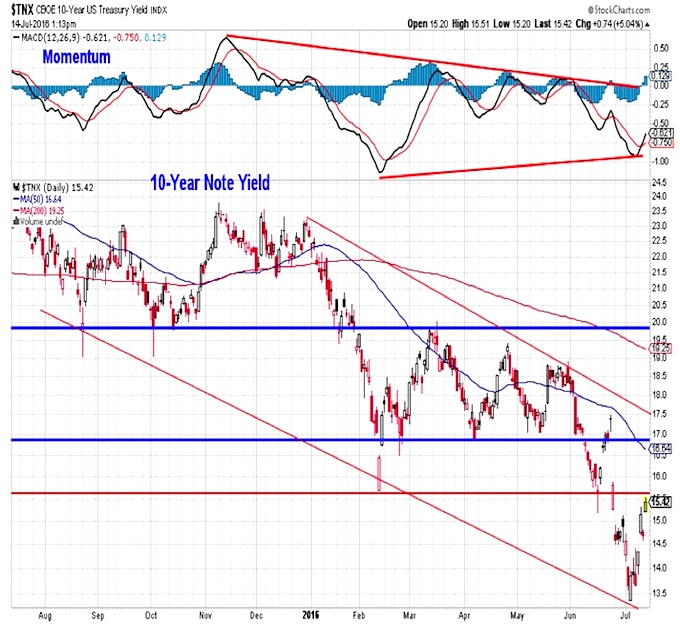
Bonds
Bonds appear to be vulnerable right here, and the post-Brexit low in yields could represent an important turning point. While the longer-term trends implications remain uncertain, we have seen excessive optimism build in bonds and that alone could support yields turning higher. Adding to this upward pressure in yields is the fact that economic surprises have gone from negative to positive over the past week and the failure of momentum to confirm the recent low yields. The early-year low for the 10-year T-Note yield (near 1.56%) could offer some near-term resistance, but 1.70% appears to be a more important level.
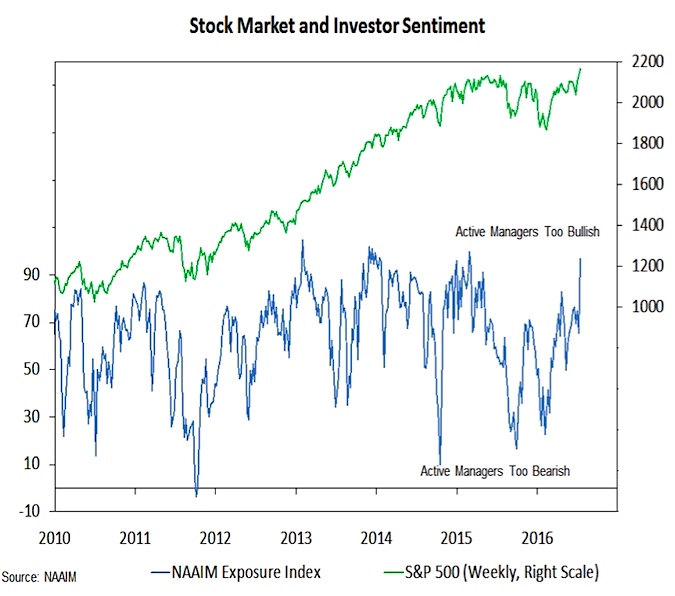
Investor Sentiment
Stock market sentiment is showing pockets of optimism. The NAAIM exposure index jumped 31 points this week and the details show that while the bearish extremes have not budged, more than three-quarters of the respondents have equity allocations of at least 80%. Optimism can also be seen in the Investors Intelligence data (52% bulls and 25% bears), while the individual investors that make up the AAII survey are more circumspect (37% bulls and 24% bears). Overall the composite sentiment indicators we keep track of show optimism just barely in the excessive zone.
continue reading on the next page…


 Pressuring Lower Price Support")


 Pressuring Lower Price Support")