Here’s a look at some key stock market charts, indicators, and themes that we are watching.
This Week’s Stock Market Outlook:
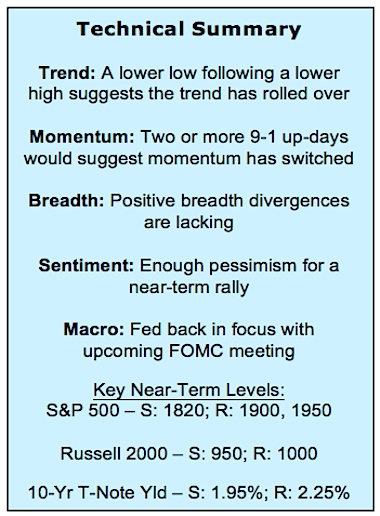
Going Back Years to Find Support – Weakness in equities has investors zooming out on their charts. On the S&P 500, 2014 levels are now in play, while on the International EAFE, it is 2012 all over again. The lower lows for the S&P 500 have followed a lower high in Q4 suggesting the trend has rolled over.
Pessimism Extremes Might Be Enough for a Bounce – Bearish sentiment remains elevated in investor surveys. While this could help fuel a bounce or stocks, the damage done to the trend and the lack of market breadth confirmation suggestions caution remains warranted.
Market Breadth Trends Not Suggesting a Low Is in Place – The break down in the broad market suggests the average stock is still in gear to the down-side. We have seen industry group trends turn lower and a sharp expansion in the number of stocks making new lows. From a macro stock market outlook view, this suggests that it is premature to expect a lasting bottom is in place. At a minimum a re-test remains likely. At that point, look for market divergences to suggest the overall tone has shifted.
Stock Market Indicators – Indices & Sectors (click to enlarge)

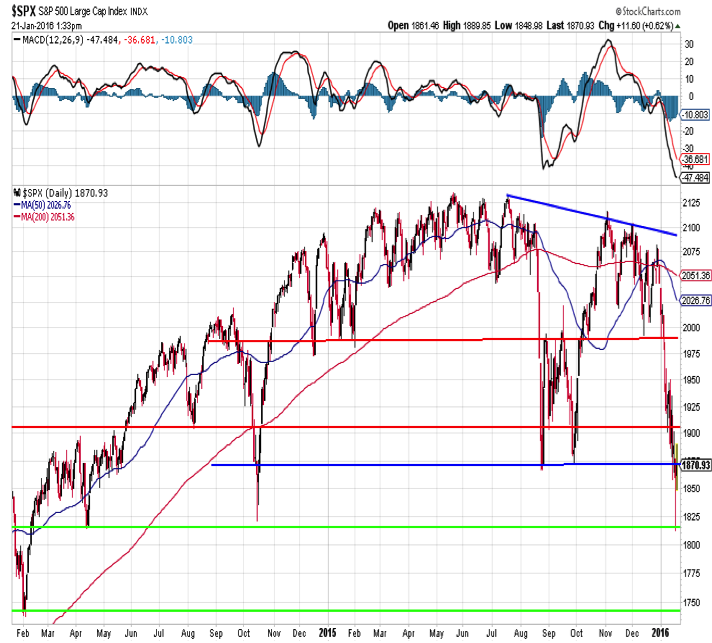
S&P 500 Index
As selling has continued in January, the search for support for the S&P 500 has moved from 2015 to 2014 (the years, not the levels). The August and September 2015 market lows have not held, and the focus now is at the 1820 level, where the S&P 500 found support in both April and October 2014. A counter-trend rally could carry the S&P 500 above initial resistance near 1900, but resistance above 1975 could be harder to crack.
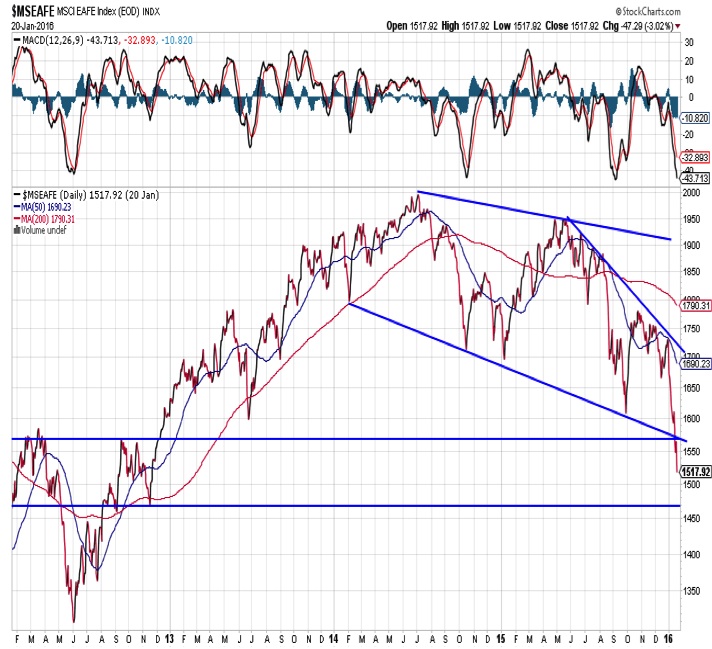
International Stocks
International stock market trends are in relatively worse shape that the S&P 500. The 2015 low on the EAFE came near 2013 low, and January’s weakness in international stocks has carried the index to levels not seen since 2012. Moreover, the pattern of lower highs and lower lows, which identifies a down-trend, goes back to the mid-2014 peak.
Stock Market Indicators
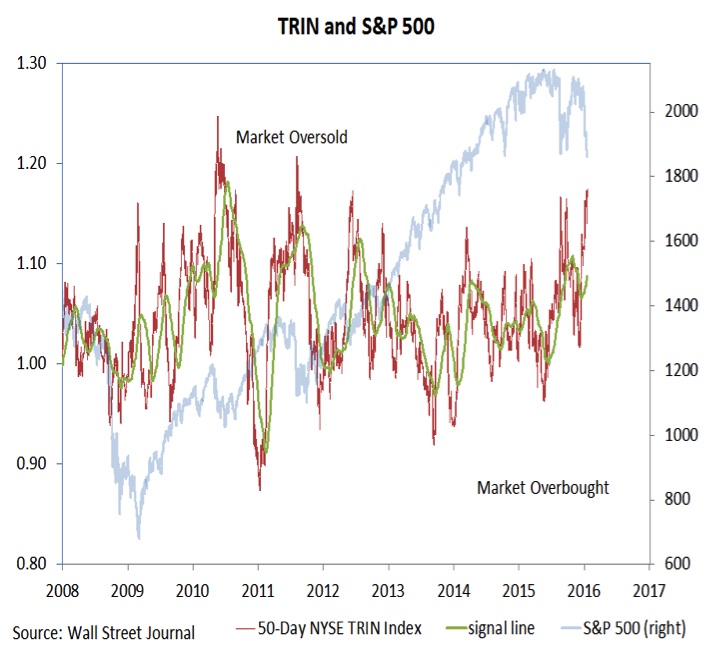
While the longer-term trends have deteriorated, there is some evidence that stocks could be poised for a near-term counter-trend rally. Based on the 50-day TRIN, stocks are as oversold as they have been since near the 2011 lows. The caution with overbought/ oversold indicators is that they work best as signals against the primary trend (overbought in a down-trend or oversold in an up-trend).
Next up, we’ll look at investor sentiment and market breadth indicators.
continue reading on the next page…


