A couple weeks ago, I did an in depth look at the USDJPY chart over the near, intermediate, and longer term. We also looked at the potential for resistance in and around the 115-116 area not he US dollar vs Japanese Yen. You can read that post here.
Well, some time has passed an it’s time for a USDJPY chart update.
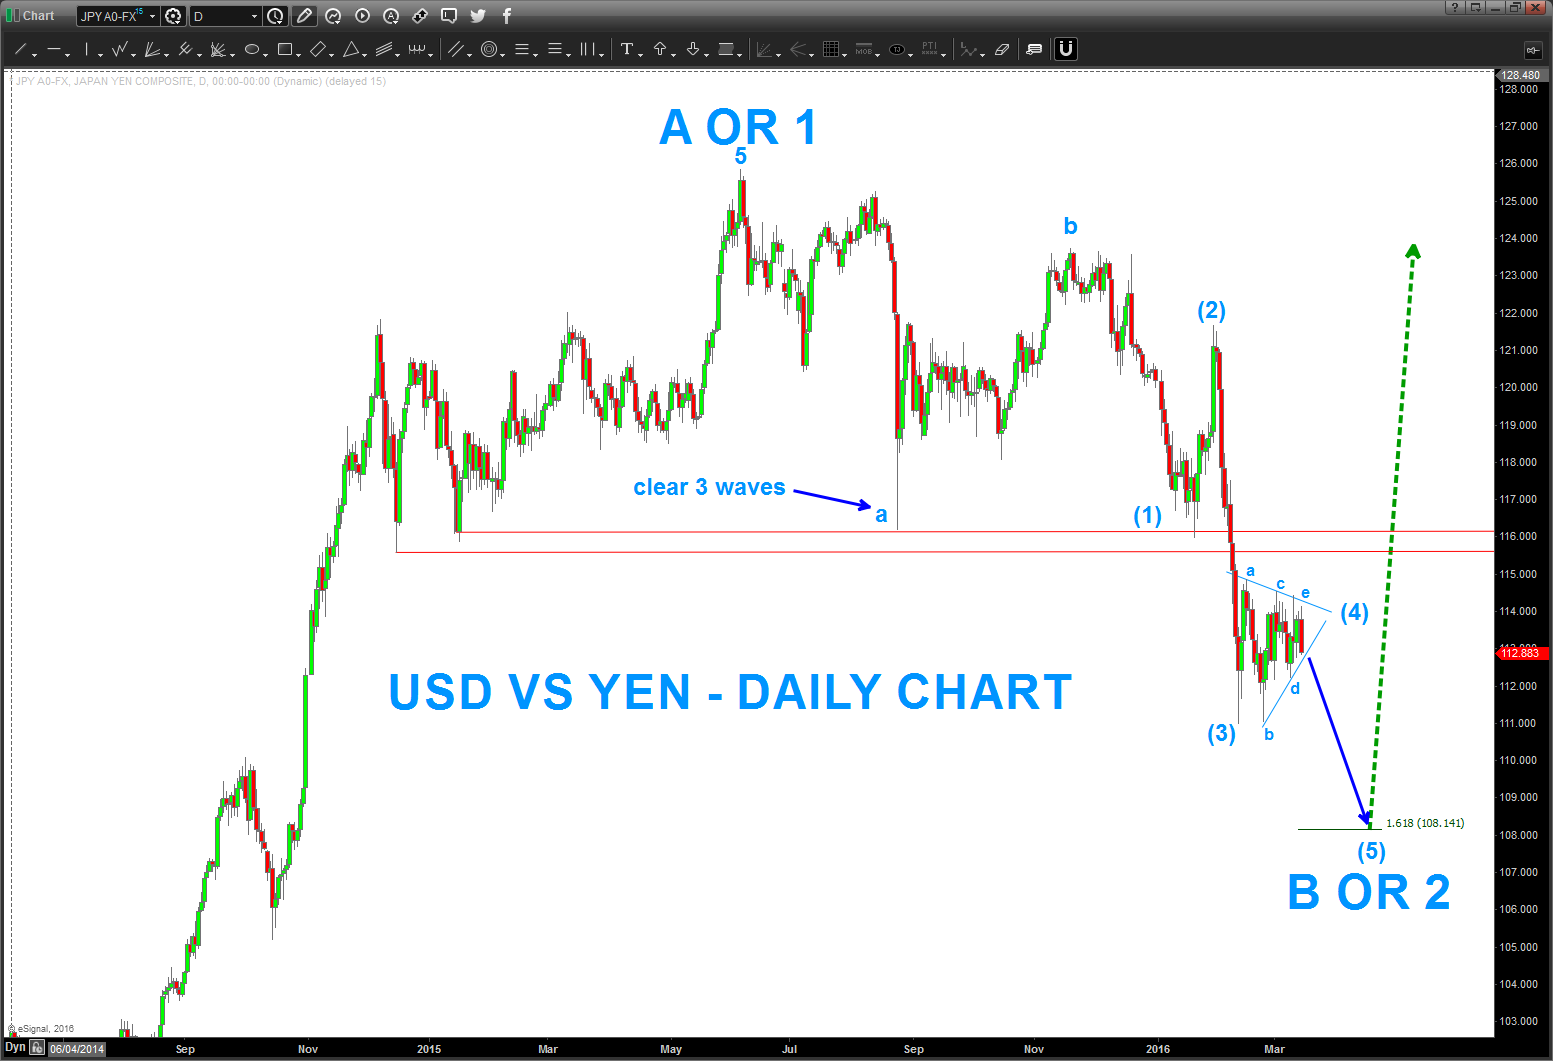
The USDJPY did not go up and test that level. Instead, it appears that it carved out a triangle and, if correct, the most recent high in/around 114.45 finished the ‘e’ wave of the triangle (a-b-c-d-e).
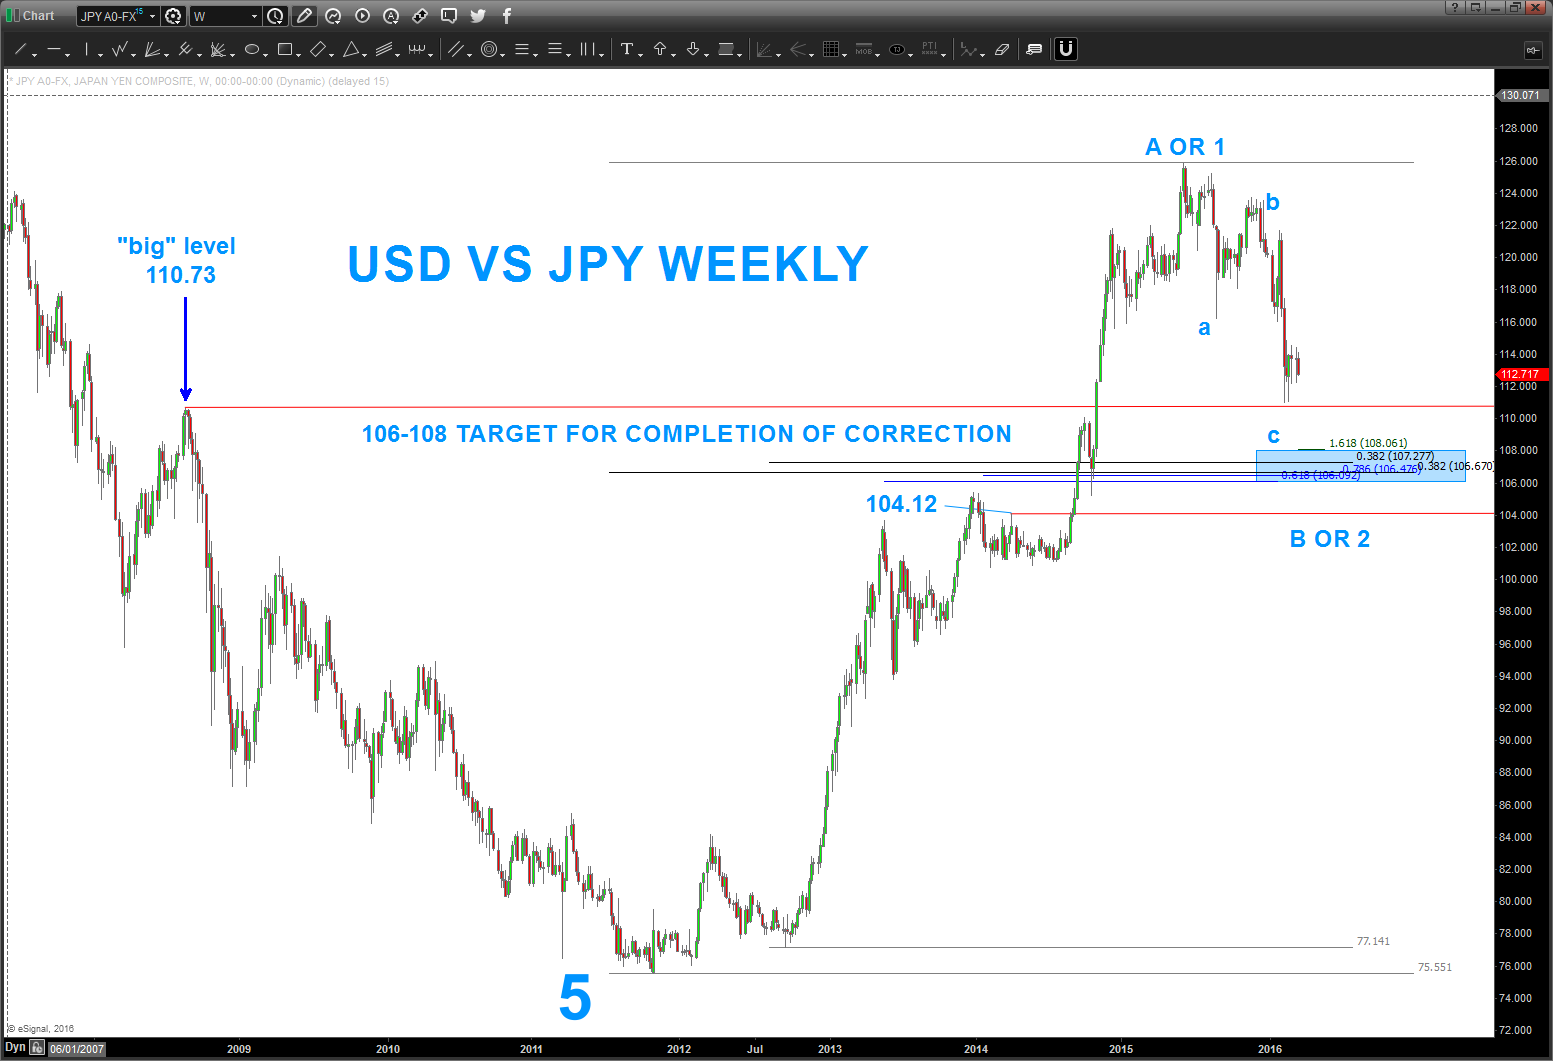
Prices should now thrust from this triangle and target the 107-108 level. If the correlation between the US Dollar and Japanese Yen holds (they move together) then this should put stress/pressure on the US Stock Market. Note, the last/final wave of an a-b-c correction has to be 5 waves.
If this analysis is correct, then we are in the final wave of the corrective ‘C’ wave and, additionally, the end of the correction that began roughly 9 months ago. One caveat – while the 107-108 level appears to be a valid and a high potential target – it does not ‘have’ to stop at that level. A ‘C’ wave is powerful and could very easily take out those levels and more.
We need to be patient here. When it’s complete, the US Dollar should soar to new highs above 125.
USDJPY Charts
Weekly
Daily
Thanks for reading and good luck out there.
Further reading from Bart: Coffee Futures Update: Big Rally Coming If Lows Hold
Twitter: @BartsCharts
Author does not have a position in mentioned securities at the time of publication. Any opinions expressed herein are solely those of the author, and do not in any way represent the views or opinions of any other person or entity.


