If you search my blog for “YEN” you’ll find that I’ve put a lot of interest and work around understanding the relationship that exists between Japanese Yen weakness and the strength in U.S. stocks and the broader U.S. equity market.
That being said, we are at one of those junctures that can help us make a game plan for the next major move in the stock market.
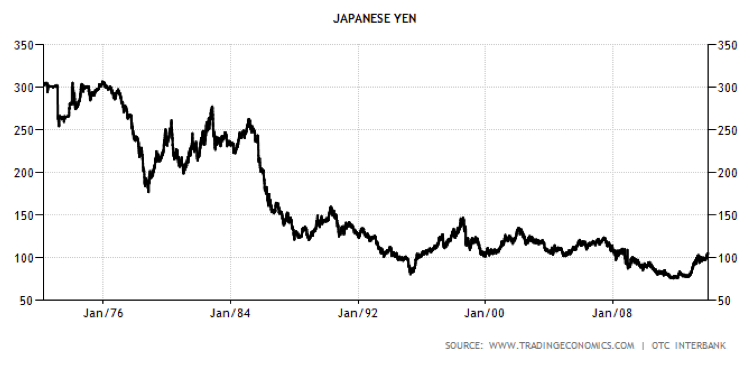
Here’s a long term chart of the Japanese Yen:
The first chart is showing the actual data since the float in 1972. Folks, the high was 306.
From Tradingeconomics.com:
Here is my rudimentary drawing to show the count that I believe is working:
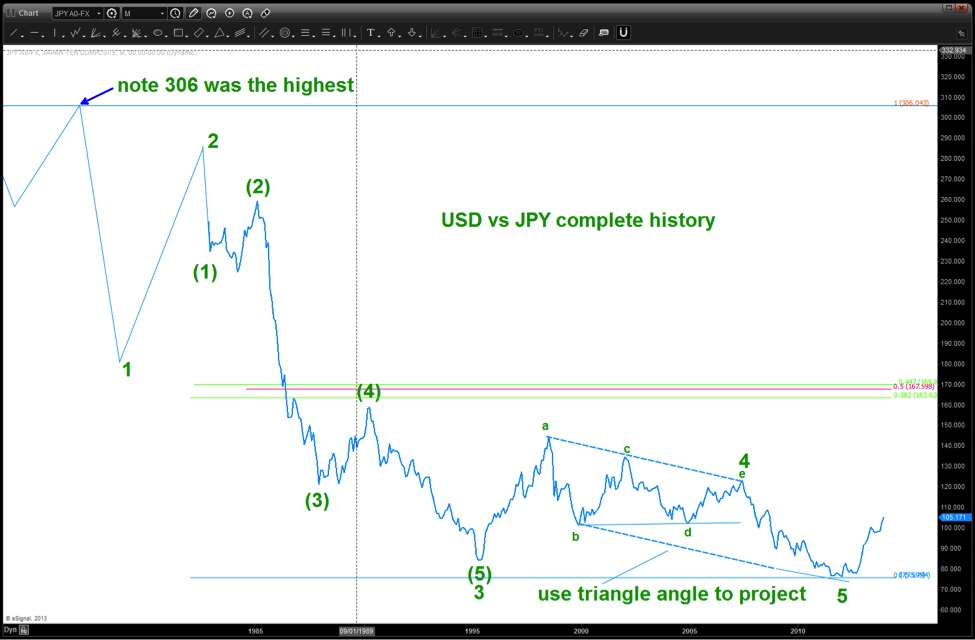
As you can see, it’s not a stretch to count 5 long term monthly waves down on USDJPY.
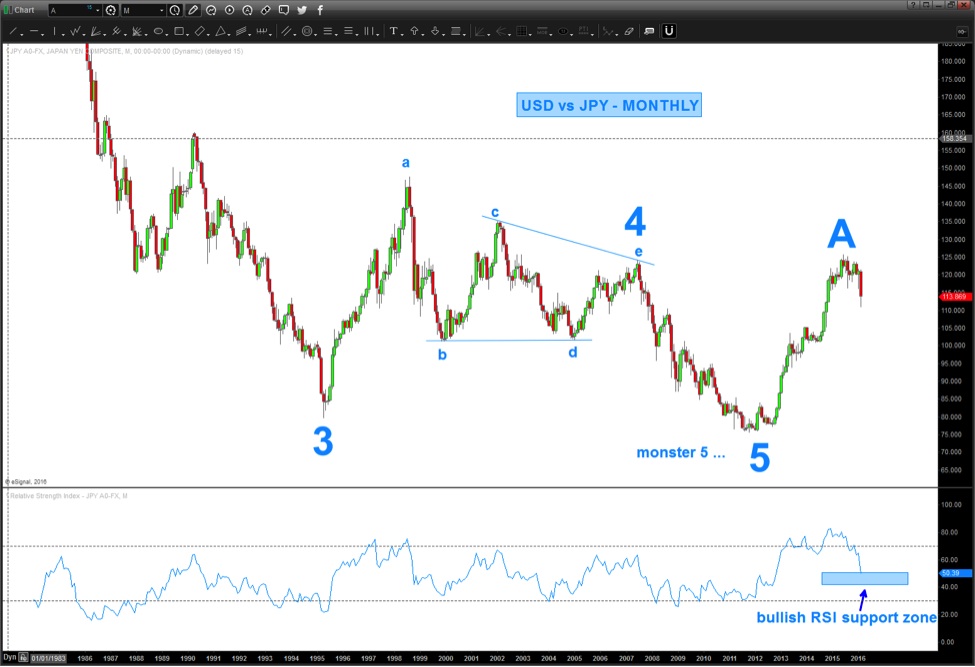
Here’s where I believe we are right now. Note, I’m labeling the most recent top “A” but it could also be, alternatively a big old “1.” It’s too early to tell for now but – either way – we have another big move coming for Japanese Yen weakness.
Here’s where the dilemma comes in… Let’s work down to a weekly chart:
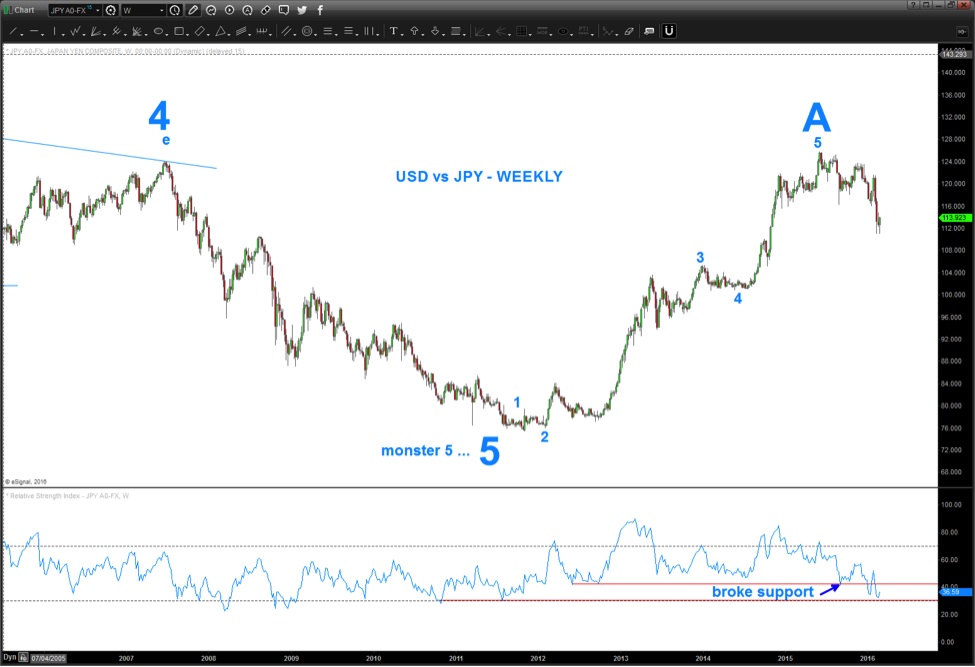
As you can see above, the TIME for this correction has been longest since the bottom in 2012. Additionally, we have gone deeper than any other correction that has occurred since the BIG 5 happened around 4 years ago. So, is this correction done and it’s off to the races.
Unfortunately, maybe and, well, maybe not ….
In the chart below you’ll see a 3-3-5 5 sequence that is relatively easy to count and shows nice symmetry. What does this mean for the Japanese Yen, et al? There is a very real chance that this is the complete correction, labeled “B” and off the USD goes versus the JPY. This is bullish for US Equities….
However, I must also point out the “alternate” count and that shows this move being “A” of the A-B-C sequence. This will then put the current weakness in a “B” wave and going up into very formidable resistance from 115.60-116.20. From in, around these levels, the “C” wave will start fresh and plummet the USDJPY to new lows and weigh heavily on US Equities.
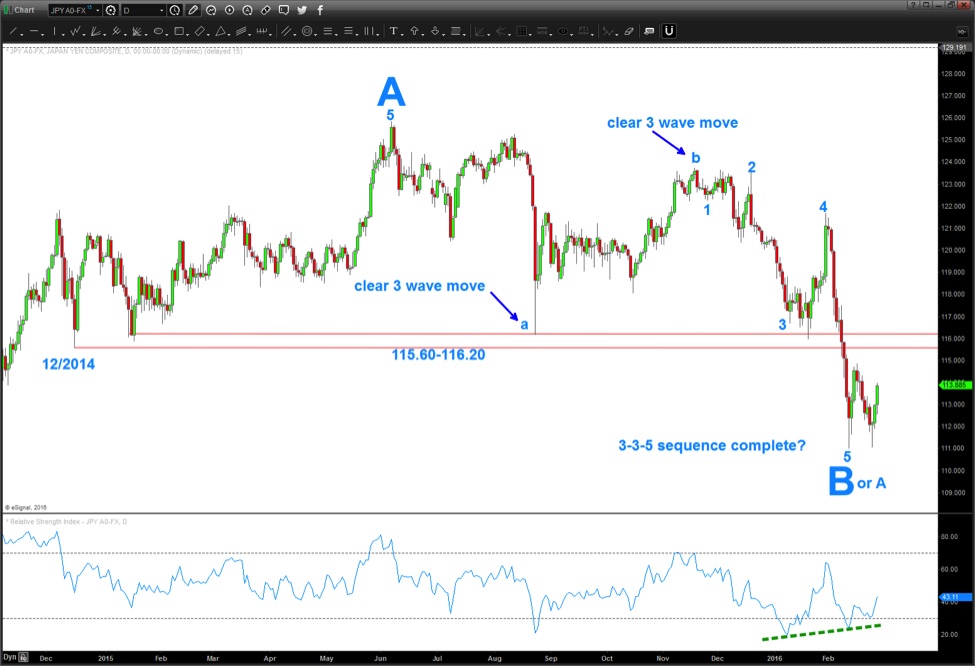
As you can see from the above, the 115.60-116.20 will be strong resistance, using the polarity principle, for the USDJPY.
continue reading on the next page…


