Looking at soybeans, the immediate price reaction was much more refrained following the release of the September 2015 WASDE report. November soybeans closed up just a ¼-cent on Friday at $8.74 ¼ per bushel, essentially pulled back to unchanged on the day due to the strength in the corn market. The USDA increased the 2015/16 US soybean yield 0.2 bpa to 47.1 bpa versus the average trade guess of 46.4 bpa. As a result, total US soybean production improved to 3,935 million bushels, just 34 million bushels shy of last year’s record production figure. And finally, the revised estimate for the 2015/16 US soybean carryout of 450 million bushels was 35 million bushels higher than the average trade guess of 415 million. As it stands, the current stocks figure dwarfs last year’s carryout estimate by an incredible 240 million bushels.
From a global perspective the stocks situation becomes even more burdensome for Soybean Bulls. The 2015/16 World Soybean carryout was lowered slightly versus a month ago; however at 84.98 MMT, it’s still record large and exceeds the previous record by 6.25 MMT. Brazil’s 2015/16 soybean crop was estimated at 97 MMT, only 10.1 MMT less than the United States. It’s worth noting that Brazil’s soybean production has grown by approximately 70% in the past 10-years. Over that same time span, US corn production has increased by just over 29%.
Technically, November soybeans made a new contract low of $8.53 ¼ on Friday morning prior to recovering late in the session. The Commitment of Traders report showed the Managed Money position in soybeans falling to a net short of -18,516 contracts as of the close on September 8th. In September of 2014 the Money Managers expanded their net short position to -33,729 contracts as of 9/16/2014. So it’s entirely possible they could choose to continue adding to their current short position. That said it’s hard to make a case for sustainable soybean rallies at the moment given the makeup of both the US and World balance sheets; however if December corn continues to rally it could pull November soybeans along with it, albeit at a distance. I’d also mention that the last time soybeans traded down into the $8.50’s was in March of 2009 and that period of depressed prices was extremely short-lived.
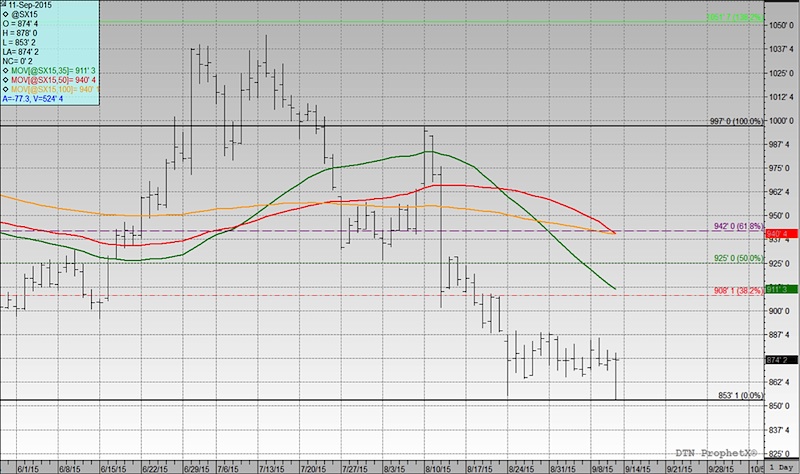
November Soybeans Futures Chart
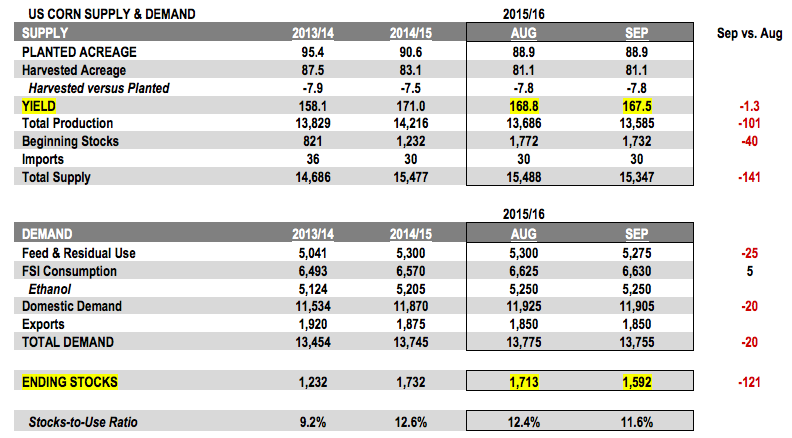
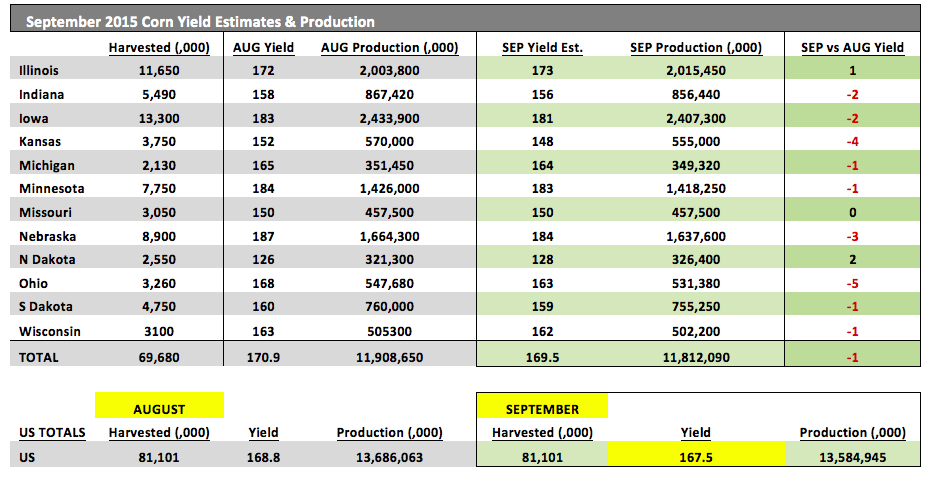
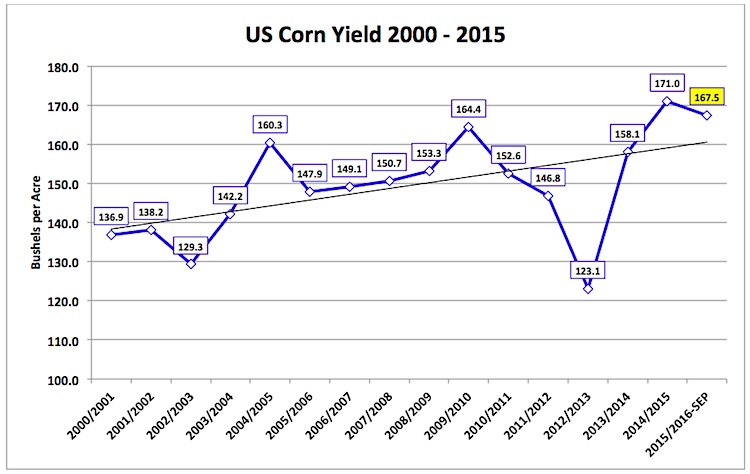
US Corn – Supporting Statistics, Estimates & Charts
Thanks for reading and have a great week.
Twitter: @MarcusLudtke
Data References:
- USDA United States Department of Ag
- EIA Energy Information Association
- NASS National Agricultural Statistics Service
Any opinions expressed herein are solely those of the author, and do not in any way represent the views or opinions of any other person or entity.


