The corn market was reduced to a standing eight count last Monday and Tuesday. Over that 2-day stretch, December corn futures closed down a combined 40-cents per bushel. The summer corn rally gave way to strong selling pressure last week. This was likely attributed to two key price drivers:
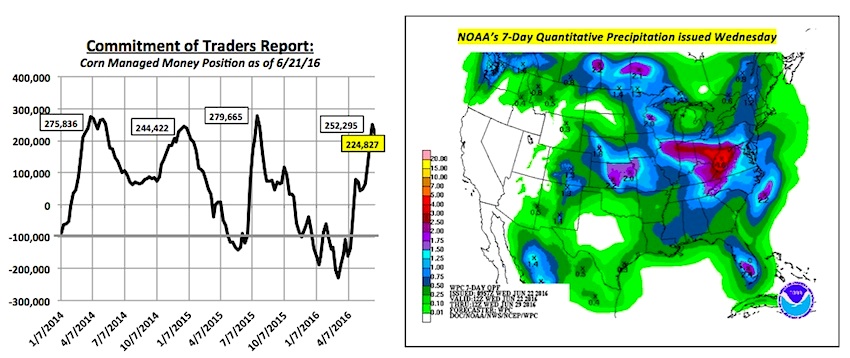
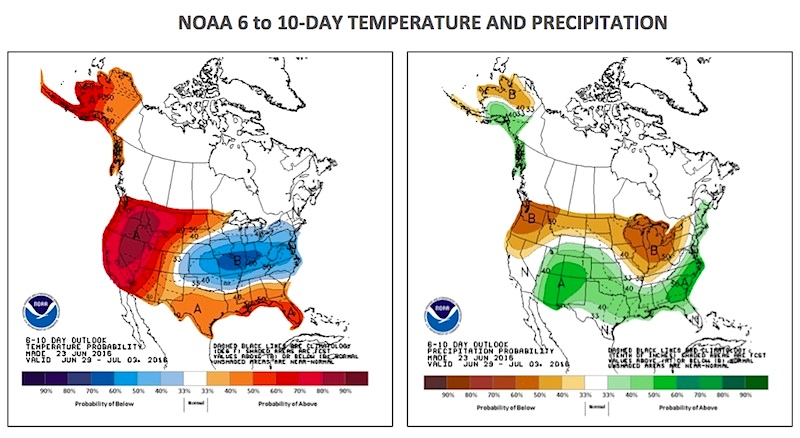
- A wetter forecast specifically for the Eastern Corn Belt (note below NOAA’s 7-Day Quantitative Precipitation forecast through June 29th issued on Wednesday, 6/22)
- Massive long liquidation from Money Managers (Managed Money corn long had increased to 252,295 contracts as of 6/14, up +209,326 contracts since 5/10 and the largest Managed Money long since 7/21/2015)
I had been suggesting for the past several weeks that I felt the corn rally had been largely manufactured via “paper” longs. They were betting on La Niña trimming corn yield prospects during the 2nd half of the 2016 growing season. That sentiment now appears to have been validated. Managed Money buying was the motivating force behind December corn futures rallying 73 ¾-cents per bushel from the day low of $3.75 ¼ on May 10th to the day high of $4.49 on June 17th. But was that it? Was that the summer corn rally? More in a bit…
Conversely these same buyers shifted to aggressive sellers last Monday morning following a sizable change in the forecast for the Eastern Corn Belt. That forecast called for heavy rains pushing through some of the dryer sections of Illinois, Indiana, and Ohio. The wave of selling persisted through Friday’s close with December corn futures (CZ6) finishing down 54 ¾-cents per bushel week-on-week at $3.94 ¼. This was just a tick above the 100-day moving average.
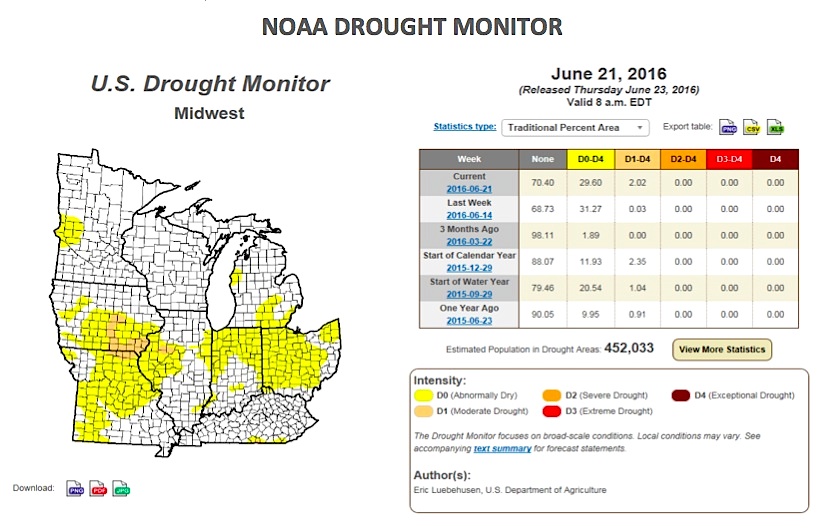
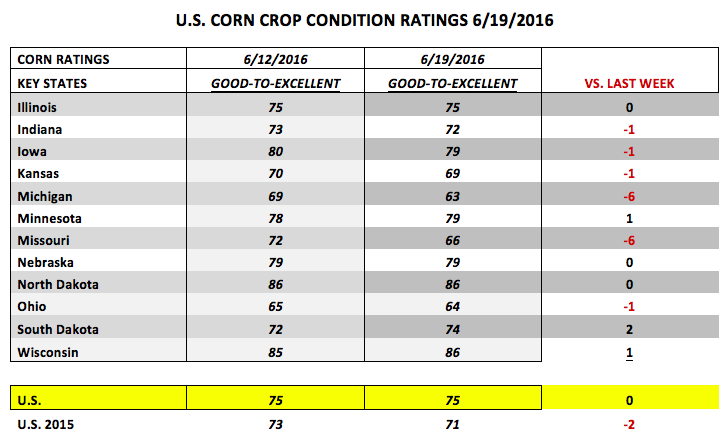
Adding to the Bearish tone Monday evening was the USDA’s Weekly Crop Progress report. This report showed the U.S. corn crop still rated 75% good-to-excellent, unchanged from the previous week. It was also 4% better than 2015 as of the week ending June 19th, 2016. Traders had been expecting a 2 to 3% decline, which simply didn’t happen. The two states that did show material weekly declines of 6% each were Michigan and Missouri; however from a national perspective those two states only account for approximately 6% of total U.S corn production. By comparison the top four corn producing states (accounting for approximately 53% of total U.S. corn production) consisting of Iowa, Illinois, Nebraska, and Minnesota all saw their state corn ratings essentially unchanged versus the previous week, ranging from 75 to 79% good-to-excellent. Therefore the message to the market was the above to sharply-above average June temperatures the Corn Belt had been experiencing the previous to 2-weeks had little, if any, lasting negative impact on crop conditions.
IS THE SUMMER CORN RALLY already over before it started?
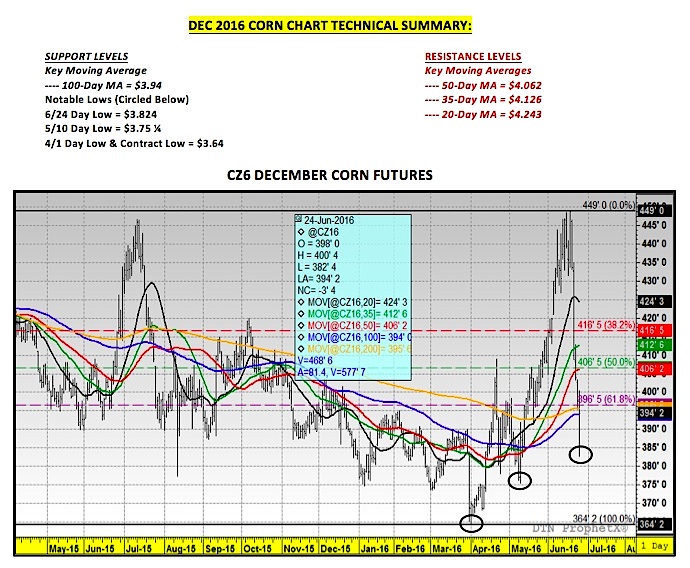
There’s no denying that significant technical damage was done to the market this week. December corn futures closed below the 20, 35, 50, and 200-day moving averages and are now within 30 ¼-cents of the current contract low of $3.64 per bushel (established on 4/1/2016). Therefore over a period of just 5 trading sessions a market that appeared poised for another leg higher following a 23-month higher close in CZ6 on June 17th of $4.48 ¾ completely and unforgivingly collapsed. How do Corn Bulls start to pick up the pieces? Is the summer corn rally already over? Below are some insights into the price action.
Corn Bulls will be forced to stick to the following talking points:
- U.S. corn export sales remain strong: Weekly corn export sales totaled 34.3 million bushels for the 2015/16 crop year and 21.7 million bushels for 2016/17 (for the week ending June 16th, 2016). Year-to-date sales for 2015/16 improved to 1,827.2 million bushels, up 52.5 million versus the previous crop year. Therefore from a sales perspective the U.S. continues to see relatively strong and consistent weekly buying interest from key world importers such as Japan, Mexico, and South Korea. Furthermore the USDA is projecting Brazilian corn exports to be down 11.5 MMT (453 million bushels) in 2016/17 from their peak in 2014/15 of 34.5 MMT due to the residual impact of Brazil’s 2015/16 drought-reduced safrinha corn crop. With Brazil serving as the world’s 2nd largest corn exporter (trailing only the United States) this export deficit should provide a prolonged bounce to U.S. corn export sales.
- U.S. ethanol production remains strong: Despite the EIA reporting U.S. ethanol production down 51,000 barrels per day week-on-week, the average run-rate for 2016 still stands at a record pace of 971,600 bpd. The average run-rate in 2015 was 959,900 bpd. Furthermore already twice during the month of June weekly ethanol production has exceeded 1.0 million barrels per day (6/3 and 6/10), which prior to this month had only occurred 3 times in history and never in consecutive weeks. Also of note, average ethanol industry plant margins still remain positive even with spot CME ethanol futures down more than 9-cents per gallon this week and DDGS values down approximately $25 per ton. That said U.S. corn-ethanol demand appears to be well supported and could even be edging higher in the USDA’s July 2016 WASDE report, which will be released on July 12th, 2016. (view U.S. ethanol and gasoline demand charts on page 6)
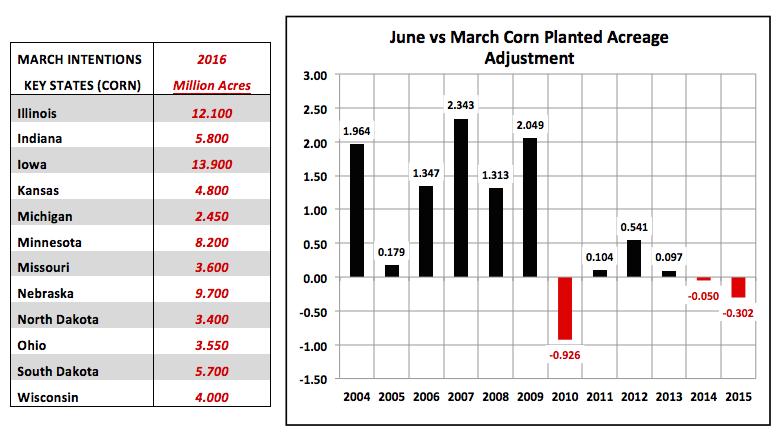
- 2016 U.S corn acreage reduction likely on June 30th: Corn traders in general are still expecting the USDA to lower planted corn acreage by as much as 1 to 1.5 million corn acres in next week’s June 30th Acreage report. I’m still seeing a number of notable private forecasts projecting approximately 92.5 million planted corn acres versus the USDA’s March Prospective Plantings estimate of 93.6 million. This negative acreage adjustment and its impact on 2016/17 U.S. corn production will then be reflected in the USDA’s July 2016 WASDE report on July 12th. Assuming the USDA lowers planted acreage 1.5 million acres and leaves the yield unchanged at 168 bushels per acre, this would lower production 251 million bushels. If the USDA makes no adjustments to total U.S. corn demand or carryin stocks, the 2016/17 U.S. corn carryout would fall to 1,757 million bushels versus 2,008 million in June.
HOWEVER, even if the 3 aforementioned, price supportive scenarios do indeed play out, there are still two major problems for Corn Bulls… any hopes of re-igniting the summer corn rally.
- Money Managers have shifted to aggressive sellers and as of Tuesday’s revised Commitment of Traders report, the Managed Money long in corn still stood at +224,827 contracts (down just 27,467 from the previous week). Now this doesn’t include any additional sales they made Wednesday through Friday; however I would assume they’re still long close to 185,000 contracts, which means their net position exposures are still overweighted significantly to the long side of the market.
- The extended Midwest weather models have clearly changed with the addition of below-normal temperatures now persisting into the first week of July, specifically for the Eastern Corn Belt. Make no mistake…Money Managers were buying corn on the Bullish “what-if” proposition of a major La Niña reducing this year’s U.S. corn yield to something well below 160 bushels per acre. That “what-if” has been decimated for the time being.
Can December corn futures rally back? My short-term answer would be yes; however instead of rallies triggering additional buying over key moving averages, which had been the trend in May and for the first 3 weeks of June, I now anticipate selling on rallies from both hedgers and Money Managers.
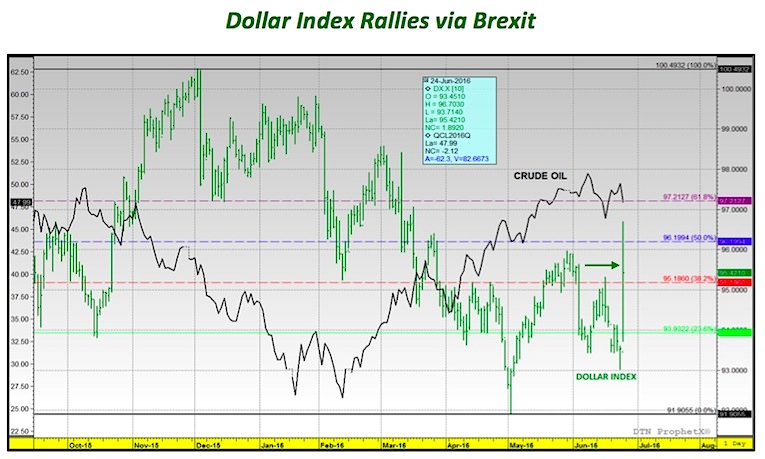
Bloomberg Summary on Immediate Financial Response to Brexit:
Global markets buckled as Britain’s vote to leave the European Union drove the pound to the lowest in more than 30 years and sparked demand for haven assets. U.S. stocks joined the selloff with the Dow Jones Industrial Average falling 385 points, though losses were roughly half what was signaled overnight.
These are among the most notable moves in global financial markets:
- British pound falls as much as 11 percent to $1.3229, weakest since 1985
- Dow Jones Industrial Average sinks as much as 500 points
- Yen strengthens 3.5 percent to 102.43 per dollar, after reaching 99.02
- FTSE 100 Index slides as much as 8.7 percent, most since 2008
- Gold surges as much as 8.1 percent to $1,358.54 an ounce
- Yield on 10-year Treasuries drops as low as 1.40 percent
- New York crude oil retreats as much as 6.8 percent to $46.70 a barrel
- Poland’s zloty, South Africa’s rand drop at least 4.4 percent per dollar, lead emerging-market currencies lower
Weather Charts
Crop Ratings & Corn Planted Acreage Charts
Thanks for reading.
Twitter: @MarcusLudtke
Author hedges corn futures and may have a position at the time of publication. Any opinions expressed herein are solely those of the author, and do not in any way represent the views or opinions of any other person or entity.
Data References:
- USDA United States Department of Ag
- EIA Energy Information Association
- NASS National Agricultural Statistics Service


 Rolling Over At Key Fibonacci Level?")


