In this article, we take a look ahead to 2020, discussing key themes and our price and crop forecast for corn.
Time for traders to turn their attention to 2020…
Let’s start by looking at some key considerations and price drivers for the 2020 corn crop.
January 10, 2020 U.S. Crop Production report:
Recent history would argue that a 2019/20 U.S. corn production cut is coming in the January Crop report. In 5 out of the past 6 years the USDA has LOWERED U.S. corn production from November to January by an average of -118 million bushels; the largest production decline coming in 2018/19 and totaling -206 million bushels.
Not surprisingly the U.S. corn yield has followed the same exact pattern with the average yield decrease from November to January being -1.6 bpa. Right now I’m forecasting a 500,000 harvested acreage reduction coupled with a 1 bpa yield decline for the January Crop report, which would equate to total U.S. corn production falling 165 million bushels from the current estimate of 13.661 billion bushels.
Assuming no adjustments are made to demand, this would effectively lower 2019/20 U.S. corn ending stocks to 1.745 billion bushels (stocks-to-use ratio of 12.5%).
Signing of the Phase-One China – U.S. Trade deal:
We’ve been told this is a done deal with U.S. Trade Representative Robert Lighthizer recently reiterating publicly “this is totally done, absolutely.” With that in mind, I’m going to assume the best in that a Phase-One trade agreement will be signed in January.
That said, there are still plenty of “unknowns” regarding how this will affect both the U.S. corn and soybean markets. No specific purchase allotments have yet to be released. However China’s JCI (Shanghai JC Intelligence Co.) recently offered import projections by commodity that would achieve total China – U.S. farm product purchases exceeding $40 billion. In that forecast the JCI showed U.S. corn exports to China totaling 8 MMT (315 million bushels), U.S. soybean exports totaling 45 MMT (1.653 billion bushels), and U.S. DDGS exports of 8 MMT. All of those totals if realized would be a welcomed and price supportive market presence for U.S. farmers in 2020.
The other price supportive market intangible for corn specifically would be a reduction to China’s current 45% import tariff on U.S. ethanol. Pre-tariff, China was the 3rd largest importer of U.S. ethanol in the world. Therefore regaining market access to China would directly benefit the U.S. ethanol industry and by extension the U.S. corn market.
2020/21 U.S. corn and soybean planted acreage prospects:
IEG Vantage recently offered its 2020 planted acreage estimates. In their summary they estimated 2020/21 U.S. corn planted acreage of 94.1 million acres and 2020/21 U.S. soybean planted acreage of 86.3 million acres. This would equate to a crop year-on-year planted acreage increase in corn totaling +4.16 million acres versus a +9.8 million acre increase in soybeans. Both figures if close to accurate stand to loom large during the first half of 2020, likely providing overheard price resistance on “sustained” rallies above $4.10 CZ20 and $9.90 SX20.
Adequate carryin stocks coupled with anticipated sizable planted acreage expansion has historically lent itself to limited upside during the Jan-FH May timeframe due to the perception of a comfortable supply cushion superseding the actual U.S. growing season, which takes center stage during Jun/Jul/Aug.
That said, 2020/21 U.S. corn ending stocks have already been estimated as high as 2.5 billion bushels as a result of 94 to 94.5 million corn acres being applied, as well as, a trend-line yield estimate approaching 178 bpa. As traders we can debate the accuracy or ability to average a 178 bpa national yield on 94 million corn acres in 2020/21; however until the market gets to next summer, those are the types of acreage/yield figures that will likely be printed in early S&D forecasts. The USDA’s March Prospective Plantings report will be released on March 31st, 2020.
Where is the next major U.S. corn demand increase going to come from?
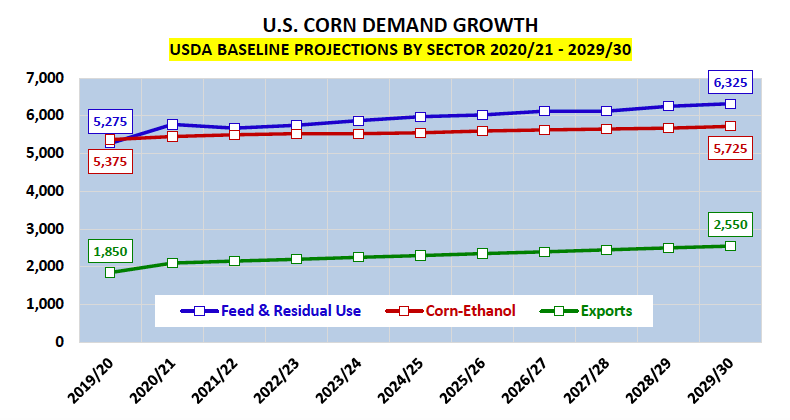
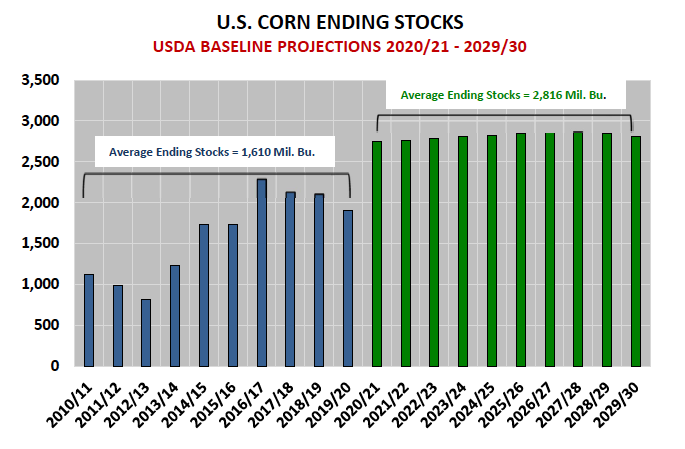
Arguably the biggest obstacle moving forward for Corn Bulls is trying to decipher how U.S. corn demand is going to go up, to offset what appears to be a continued rise in U.S. corn production potential. This was highlighted recently in the USDA’s Baseline U.S. corn ending stocks projections through 2029/30 (which were released in November). In the USDA’s models they estimated average U.S. corn ending stocks of 2.816 billion bushels for crop years 2020/21 – 2029/30.
By comparison, the largest actual U.S. corn carryout since 1987/88 was 2.293 billion bushels in 2016/17. This would then suggest that the average U.S. corn carryout is expected to be 523 million bushels higher through 2029/30 than the largest stocks figure the U.S. has had in over 30 years. That’s a problem for Corn Bulls.
Furthermore when assessing each major demand sector it’s even harder to qualify exactly where that demand increase might come from. Looking at corn-ethanol demand, the USDA is forecasting only a 120 million bushel increase in consumptive demand over the next 10-years versus the recent high of 5.605 billion bushels in 2017/18.
Considering the U.S. government’s recent handling of SRE’s, as well as, the negative influence of tariffs on U.S. ethanol imports into China and Brazil it’s hard to argue with the USDA’s projections. The USDA is forecasting some growth in U.S. corn export potential; however even that I find highly debatable. Consider this…in February 2010 the USDA released its same Baseline projections through 2019/20. In that report the USDA forecasted 2019/20 U.S. corn exports of 2.425 billion bushels. Flash forward to present and this crop year’s actual export estimate is 1.850 billion bushels.
As long as I’ve tracked the USDA’s Baseline projections (the past 20-years), the USDA has routinely overestimated U.S. corn export growth potential. Why? The USDA has underestimated increases in South American corn and soybean production, as well as, corn production increases in Ukraine. I’m going to assume that pattern will continue. And finally when it comes to Feed & Residual Use, there are too many competing feed substitutes now to believe that sector will show any measurable gains through 2029/30.
CORN FUTURES TRADING OUTLOOK
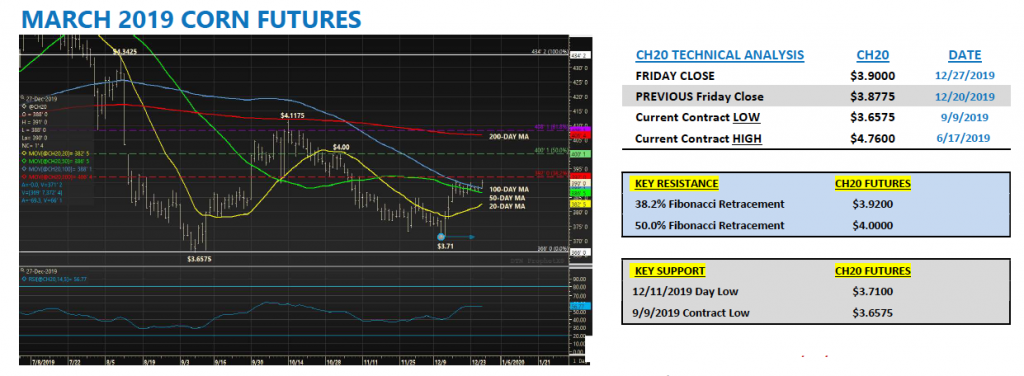
March corn futures crept higher this week, consistently challenging and eventually closing over key topside resistance at the 100-day moving average ($3.881), an area that’s capped rallies since August. Despite the higher weekly close CH20 has still shown an inability to move much beyond the $3.90 price level. That said the next 5 to 10-cents higher should prove much more difficult without some new wave of market “friendly” news.
Weekly export sales in corn failed to follow through on last week’s impressive total (67.3 million bushels); coming in this week at just 24.6 million bushels.
Crop year-to-date U.S. corn export sales increased to 701.7 million bushels versus 1.233 billion bushels a year ago (-43% or -531.5 million bushels). I still think it’s possible the USDA comes down on their current 2019/20 U.S. corn export forecast of 1.850 billion bushels in either the January or February WASDE reports if sales don’t substantially improve over the next 3 to 4 weeks. Remembering again Brazil’s domestic corn supplies are reportedly extremely tight and should remain so prior to the harvest of its full-season corn crop in February (which only accounts for approximately 25 to 27% of Brazil’s total corn crop). Therefore the U.S. needs to take advantage of Brazil’s current absence from world corn export market.
Meanwhile weekly U.S. ethanol production surged to 1.083 million b/d, up from 1.064 million b/d the previous week.
This represented the second highest run-rate on record (trailing only the 1.096 million b/d average for the week ending June 7th, 2019). So much for the ethanol industry running at something less than full capacity. In my opinion this isn’t sustainable (even with a minor week-on-week ethanol stocks decline). Gasoline demand is likely to crater during Jan/Feb, which invariably means ethanol stocks will increase and the ethanol market will have to go back to pressuring ethanol values to further contract ethanol margins.
I wouldn’t chase fresh corn longs above $3.95 CH20. I don’t see any fundamental news to justify a move beyond that level at this time.
Twitter: @MarcusLudtke
Author hedges corn futures and may have a position at the time of publication. Any opinions expressed herein are solely those of the author, and do not in any way represent the views or opinions of any other person or entity.

: Worrisome to Broader Market?")

