September corn futures closed down 22 cents per bushel week-on-week (throughout Thursday), finishing at $3.93 on August 1st. NYSEARCA: CORN
Let’s review key news and corn market drivers for this past week.
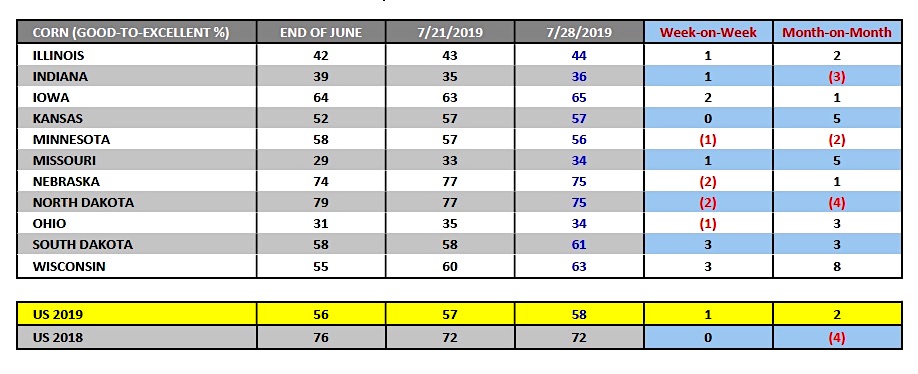
Monday’s Weekly Crop Progress report showed the U.S. corn good-to-excellent rating improving 1% week-on-week to 58%; this for the week ending July 28th, 2019. The trade was looking for an unchanged rating of 57%.
Of the top 5 corn producing states in the country (which collectively accounted for approximately 61% of total U.S. corn production in 2017 and 2018) Iowa, Illinois, and Indiana all saw their state ratings improve versus a week ago.
Most notably Iowa’s good to-excellent rating was up 2% to 65%. Meanwhile Minnesota’s good-to-excellent rating dropped 1% to 56% with Nebraska’s rating slipping 2% to 75%. See image below.
What has been the trend in corn ratings over the last month?
At the end of June the U.S. corn crop was rated 56% good-to-excellent. Comparatively a month later that rating is now up 2% to 58%. Illinois, Iowa, Kansas, Missouri, Nebraska, Ohio, South Dakota, and Wisconsin all currently are posting higher good-to-excellent ratings than they did on June 30th. Meanwhile Indiana, Minnesota, and North Dakota have experienced month-on-month ratings declines.
Can we discern anything meaningful regarding current crop condition ratings relative to a month ago?
In my opinion, no.
The state increases or decreases in most cases have been insignificant. It appears crop surveyors are hedging their bets on 2019 yield potential with just 58% of the U.S. corn crop “silking” versus 90% in 2018 and the 5-year average of 83%. Meanwhile corn entering the “dough” stage was estimated at just 13% versus 35% in 2018 and the 5-year average of 23%. The Corn Bull will tell you the deep green color of the crop, cool temperatures/benign weather conditions, and in most cases adequate subsoil moisture profiles, are masking yet to be realized significant yield declines compared to 2017 and 2018. Therefore I’m going to attribute the lack of movement in corn ratings to surveyors not wanting to be exposed in 45-days for making any type of definitive call on the direction in state and/or national corn yields.
On Tuesday President Trump via his Twitter account referenced continued setbacks in ongoing trade negotiations with China. He also alluded to China not following through on a prior agreement to buy more U.S. agricultural products. Trump concluded his succession of tweets by essentially warning China from trying to wait out his term, suggesting any deal made during his second term would be even tougher.
Those comments were enough to sour the grain market’s mood regarding any meaningful progress being made this week toward a trade deal with Chinese and U.S. negotiators meeting in Shanghai. The continued lack of export demand for both U.S. ethanol and soybeans specifically has weighed on corn/soybean futures now for several months.
Wednesday’s EIA report showed U.S. ethanol stocks climbing to a new record high of 24.468 million barrels as of 7/26/19; exceeding the previous high-water mark of 24.448 million barrels on 3/22/19.
Arguably even more concerning for the ethanol industry was the increase in stocks despite weekly ethanol production dropping to 1.031 million barrels per day, the lowest weekly run-rate since 4/26/2019. Ethanol demand decreases via the loss of China as a key U.S. ethanol importer coupled with the EPA granting more than 50 small refinery exemptions for blending ethanol (equating to approximately 2.6 billion gallons) have been the primary catalysts for rising inventory levels.
Thursday’s Export Sales summary showed weekly old-crop U.S. corn export sales of 5.6 million bushels for the week ending 7/25/2019.
Crop year-to-date sales (2018/19) inched higher up to 1.937 billion bushels, 17% behind a year ago. Yet another week of disappointing U.S. corn export business. The 2018/19 marketing year for exports ends on August 31st, 2019.
US Corn Futures Trading Outlook
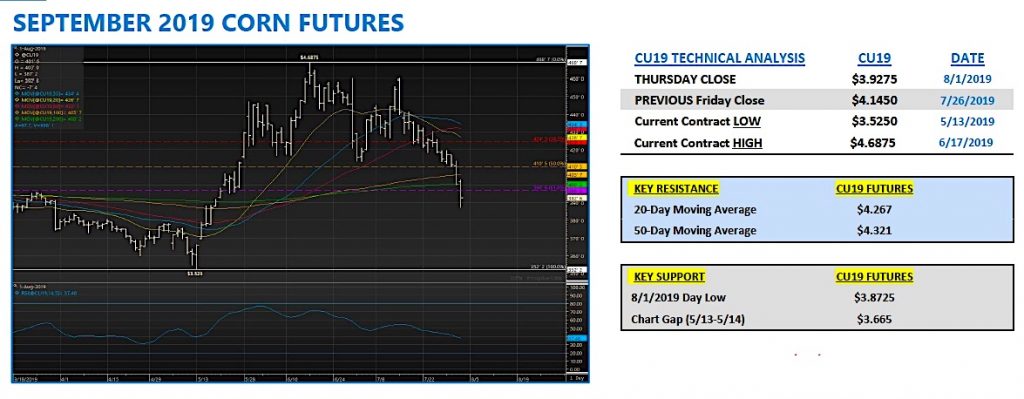
Corn futures got stupid to the downside this week, flushing out a combination of Managed Money longs, as well as, forcing some Spec longs to liquidate their positions on a downward correction that breached the 200-day moving average and 61.8% Fibonacci retracement.
I say “stupid” because although I’ve often been the contrarian voice of price negativity when September corn futures were back up trading at $4.60 on 7/15, the current break is too much too soon in my opinion with the August WASDE report now just one full trading week away. Make no mistake. I fully expect a significant cut to U.S. corn planted/harvested acreage in the August WASDE report.
I recently toured large sections of western Iowa, western Minnesota, and southeastern South Dakota and the amount of unplanted acres this year is incredible.
Furthermore the amount of acres that still haven’t tasseled as of August 1 is even more alarming. And when you consider that this area of the Corn Belt isn’t even considered the focal point of what’s expected to be the largest states with massive prevent plant acres (Illinois, Indiana, Ohio), it’s quickly shifted my stance on both U.S. corn acreage and corn yield potential for 2019.
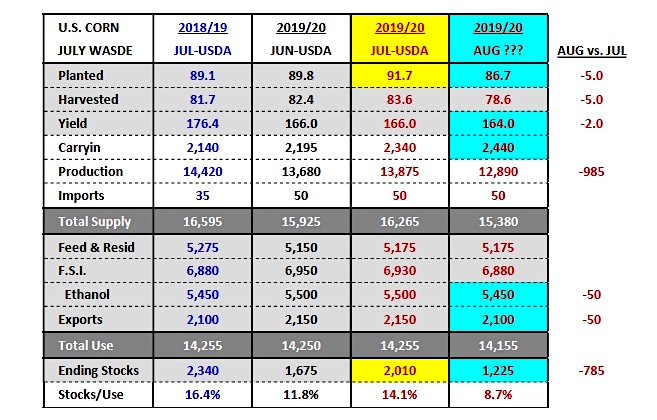
In my latest 2019/20 U.S. corn S&D model I lowered planted acreage 5 million acres (86.7 million) and took the U.S. corn yield down to 164 bpa.
This reduces 2019/20 total U.S. corn production 985 million bushels versus July to 12.890 billion. Even when I factor in higher carryin stocks, as well as, minor decreases to 2019/20 U.S. corn-ethanol demand and exports, 2019/20 U.S. corn ending stocks fall to 1.225 billion bushels. I should also add there are several private analysts using a production total figure closer to 12.4 to 12.2 billion bushels (lower harvested acreage skew and U.S. corn yield at or below 160 bpa), which then generates a carryout well below 1.0 billion bushels.
Has the Corn Bear now turned Bullish?
At current price levels, yes. With September corn futures on an 81 ½-cent break from their contract high of $4.68 ¾ and the August WASDE report now only one-full trading week away, I’m viewing this area as a good place to reestablish some market length.
That said the most unpredictable market-mover going forward isn’t weather or monthly WASDE reports but rather President Trump’s twitter account.
This was evidenced yet again late in Thursday’s trading session when President Trump felt the need to tweet out his intentions of raising tariffs on $300 billion of Chinese goods another 10% beginning September 1st. Immediately corn and soybean futures sold off to their lowest levels since May. Crude oil futures and the equity markets also cratered. President Trump’s twitter account remains the most powerful marketing weapon on the planet and unfortunately for specs and hedgers alike, there’s no discernible pattern to the timing of his next tweet-grenade on commodity values.
However, barring an unexpected social media cleanse, I think we have to assume the next Trump tweet-grenade is only a matter of time. Therefore, it’s not if but when…this is what keeps me reaching for the CBD oils at night.
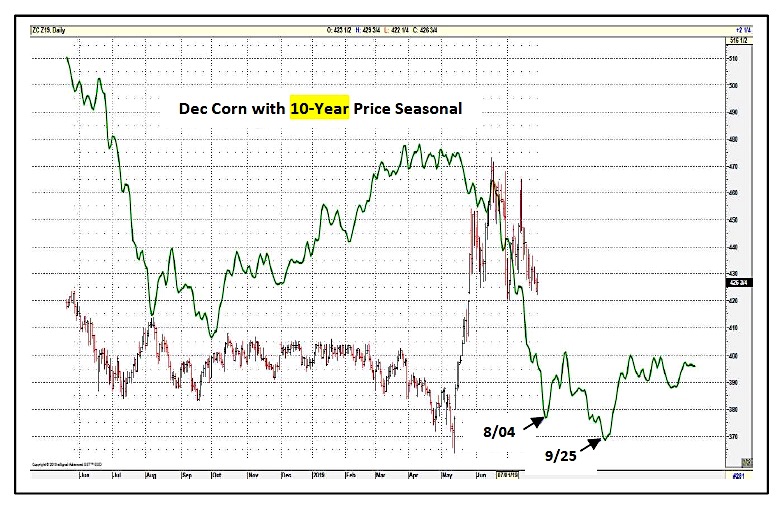
Corn Seasonality
Twitter: @MarcusLudtke
Author hedges corn futures and may have a position at the time of publication. Any opinions expressed herein are solely those of the author, and do not in any way represent the views or opinions of any other person or entity.

: Worrisome to Broader Market?")
