Corn news and market analysis for the week of October 28, 2019.
Here’s a look at recent corn data and news highlights, along with my analysis and outlook for Corn futures prices.
Monday’s Weekly Crop Progress report showed the U.S. corn harvest improving to 30% complete as of October 20, an 8% increase week-on-week, which compared to 48% harvested in 2018 and the 5-year average of 47%.
More importantly the percentage of corn now estimated as “mature” (and therefore by definition no longer at risk from freezing temperatures) increased to 86% nationally versus 99% a year ago and the 5-year average of 97%.
That said, several key corn producing states still reported “mature” percentages well behind a year ago, which remains a significant concern moving forward due to the return of sharply below-normal temperatures for the entire Corn Belt into and through the end of October (see NOAA outlook).
For example, North Dakota’s corn crop was forecasted at just 65% mature versus 98% in 2018, Ohio 72% versus 96%, South Dakota 74% versus 96%, Michigan 62% versus 94%, and Wisconsin 61% versus 96%. Those 5-states collectively were projected to produce 2.23 billion bushels of corn as of the October 2019 Crop Production report, accounting for 16.2% of total 2019/20 U.S. corn production.
Current “mature” percentages would indicate that approximately 25% of that cumulative production figure is now likely to be negatively impacted by upcoming freezing temperatures, which invariably should lead to lower test weights and some anticipated yield drag relative to previous forecasts.
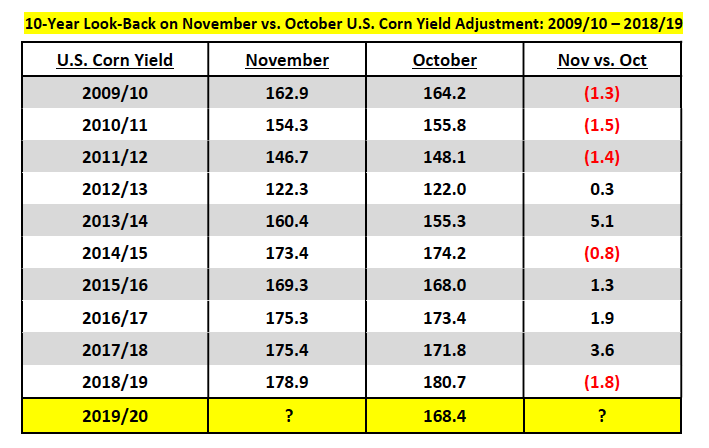
That said, when I combine the bushels lost due to the recent snowstorm in the Dakota’s along with some additional crop losses now likely in the Eastern Corn Belt I’m leaning more heavily toward a 200 to 250 million bushel U.S. corn production decline in the November 2019 WASDE report (U.S. corn yield ranging from 165.4 to 166.0 bpa versus 168.2 bpa in October). For what it’s worth the largest October to November yield decline in the past 10-years has been -1.8 bpa in 2018/19.
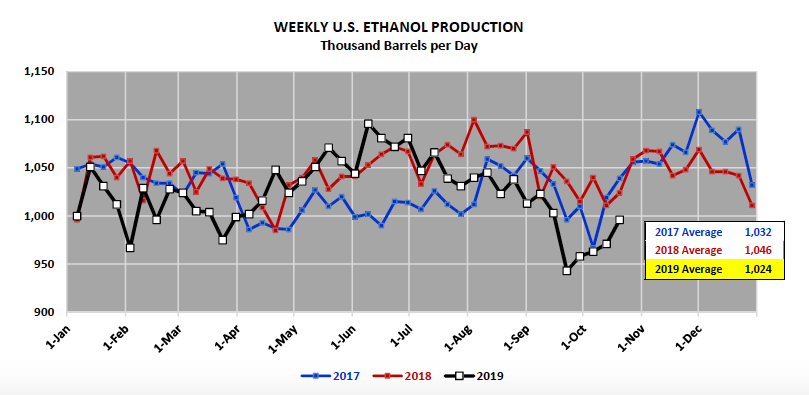
In Wednesday’s EIA report weekly U.S. ethanol production was reported at 996,000 barrels per day for the week ending October 18.
This represented a 25,000 bpd increase from the previous week. That said this was the fifth consecutive week production has failed to eclipse 1.0 million barrels per day, which hasn’t happened since Sep/Oct 2016 (9/23/16 – 10/21/16). Meanwhile, U.S. ethanol stocks fell to 21.4 million barrels versus 22.1 million barrels the previous week and 23.9 million barrels for the same week a year ago.
Industry wide ethanol margins have improved of late due in part to the collective reductions in both run-rates and stocks, which in turn has produced the intended effect of higher prompt ethanol values. At the end of August, Chicago Rule 11 ethanol was trading at approximately $1.38 per gallon. By October 11, Chicago R11 had rallied all the way up to $1.60 per gallon. Values have since corrected downward but have still managed to consolidate at or near $1.50 per gallon.
And while December corn futures have also strengthened over that same time period, the gain in ethanol values has exceeded the recovery in corn prices allowing for a sizable improvement in the ethanol crush margin. That said as it relates to the 2019/20 U.S. corn S&D, I still remain of the opinion that USDA will likely lower its current corn-ethanol demand estimate of 5.400 billion bushels by at least 25 to 50 million bushels in either the November or December WASDE reports.
The general belief is that the recent improvement in ethanol margins will prove short-lived with facilities currently running at less than 100% capacity likely to ramp back up production as new-crop corn supplies become more available. For this reason, the ethanol market continues to trade in approximately a 6 to 7-cent per gallon inversion even from October to November. Therefore the forward margin curve remains negative.
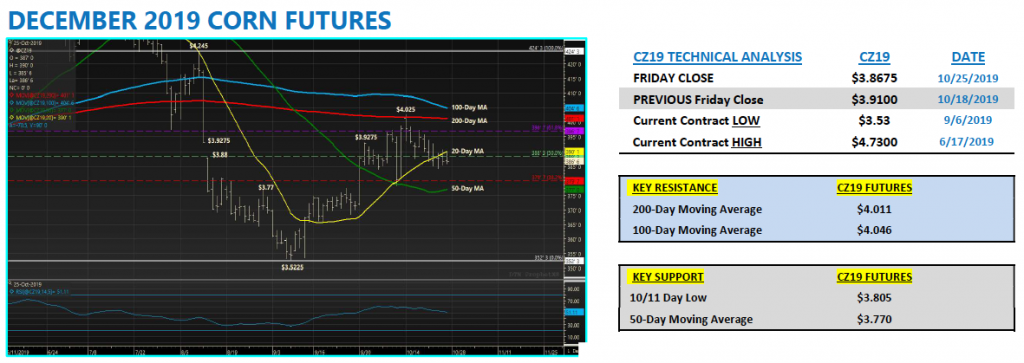
Corn futures traded sideways to lower for the better part of the week, eventually succumbing to 3 consecutive closes below the 20-day moving average of $3.901, which had been a key area of price support.
December Corn Future Trading Outlook
Is there a trade to be made at current price levels? With CZ trading in the mid-$3.80’s this is not an area where I’d make a pure directional play in corn futures (up or down). Ideally at this time of year, the preferred position is to utilize the seasonality, which historically lends itself to fairly narrow trading ranges.
This suggests executing selling an options strangle at the perceived extremes of the current trading range (i.e. selling a $4.00 CZ19 call and a $3.80 CZ19 put); however, with implied volatility trading sub-18% in December options there simply isn’t enough of a premium incentive to make this trade. Therefore, I’m in a holding pattern until CZ19 either breaks below $3.80 or triggers some buy-stops above the 200-day moving average at $4.011.
From purely a fundamental perspective, the market (soybeans in particular) appears to be tiring of the China-U.S. ‘’phase one” trade deal narrative (note November soybeans closing down 13-cents per bushel on Friday).
This week we essentially learned that at least for 2020 it’s now assumed that even if a deal is reached China’s U.S. agricultural purchases will likely reset to $20 billion, which is the equivalent of what China purchased in 2017. That’s still a positive but it’s far from the $40 to $50 billion purchase target President Trump initially implied would occur approximately 2-weeks ago when rumors of a potential trade deal first began to circulate.
There’s also the unfortunate problem of African Swine Fever, which is still ravaging several Asian countries. This has greatly reduced soybean import demand in China with 2019/20 Chinese soybean imports currently forecasted at just 85 MMT versus the pre-ASF outbreak record high of 94.1 MMT in 2017/18. Meaning even if China returns to buying U.S. ag commodities on a consistent basis, the market isn’t as deep as it was 2-years ago for other non-tariff related reasons. Brazil also continues to export record volumes of soybeans further displacing U.S. sales.
Overall, with the November 2019 WASDE report still 2 full trading weeks away from being released, I expect more of the same in corn futures. I have no desire to force a trade at current price levels.
Twitter: @MarcusLudtke
Author hedges corn futures and may have a position at the time of publication. Any opinions expressed herein are solely those of the author, and do not in any way represent the views or opinions of any other person or entity.

: Worrisome to Broader Market?")

