The market’s attention has been focused squarely on the USDA’s March 29 Prospective Plantings report.
The results of that report are as follows:
2019 U.S. corn planted acreage was estimated at 92.792 million acres, which compares to the average trade guess of 91.33 million acres and 2018 U.S. corn planted acreage of 89.13 million acres.
At the February Ag Outlook Forum the USDA estimated 2019 U.S. corn planted acreage at 92.0 million acres.
Over the last 10-years there have been 5 increases in U.S. corn planted acreage from March versus Final (post-harvest January figures) averaging +0.90 million acres. The largest increase coming in 2012, which was a gain of +1.43 million acres. Conversely there have also been 5 decreases in U.S. corn planted acreage from March versus Final averaging -1.01 million acres. The largest decrease coming in 2013, which was a loss of -1.92 million acres.
MY REACTION: Shocked. I did not expect to see an acreage figure north of 92.0 million.
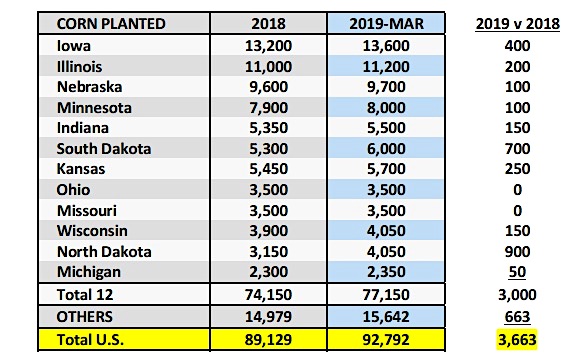
After examining the state corn acreage adjustments year-on-year (see below) I think it’s worth noting that of the 3.66 million acre increase nationally, 1.60 million of those additional acres (44%) are expected to come in North and South Dakota. Both states consistently rank #1 and #2 for prevent planting. Furthermore North Dakota’s corn yield was 153 bpa in 2018 with South Dakota finishing at 160 bpa, both well below the national average of 176.4 bpa.
The other point I would make is that this survey is conducted during the first two weeks of March and includes responses from approximately 82,400 farm operators. Therefore there’s no denying it’s a substantive sample size; however clearly acreage shifts during the spring still occur due to weather, as well as, economics.
That said I continue to believe that over time U.S. corn acreage will dip back under 92.0 million acres, which is consistent with the average planted acreage decline in 5 of the past 10-crop years. Regardless…Corn Bulls will have to trade the number for now. The USDA will not revise its March acreage figures until June 28th, 2019.
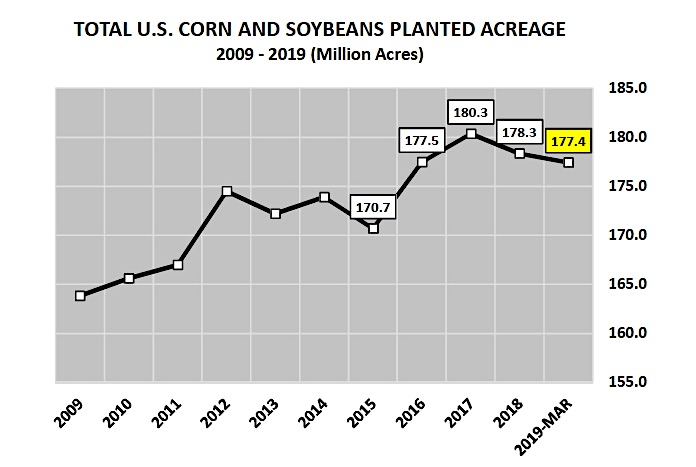
2019 U.S. soybean planted acreage was estimated at 84.617 million acres, which compares to the average trade guess of 86.17 million acres and 2018 U.S. soybean planted acreage of 89.20 million acres.
At the February Ag Outlook Forum the USDA estimated 2019 U.S. soybean planted acreage at 85.0 million acres.
Over the last 10-years there have been 6 increases in U.S. soybean planted acreage from March versus Final (post-harvest January figures) averaging +1.44 million acres. The largest increase coming in 2012, which was a gain of +3.30 million acres. Conversely there have been 4 decreases in U.S. soybean planted acreage from March versus Final averaging -1.14 million acres. The largest decrease coming in 2015, which was a loss of -1.98 million acres.
MY REACTION: Not completely surprised. I felt strongly that producers would likely make some tangible cuts to their acreage intentions for soybeans based on expected record high 2019/20 U.S. soybean carryin stocks of 900 million bushels.
If you were to ask a number of private risk managers whether they were more optimistic about the potential for extended rallies this summer in corn or soybeans I would argue most would have said corn. The primary reasons being that the soybean market due to the combination of record stocks (U.S. and World) coupled with continued uncertainty regarding future U.S. soybean export business to China would collectively act as strong topside resistance in November soybean futures above $9.60 to $9.70 per bushel (even with a slightly below-trend yield). In corn a stronger argument could be made for rallies beyond last year’s price ceiling in December corn futures of approximately $4.30 per bushel.
That said the soybean market has given the impression that it’s probably going to take another crop cycle (maybe two) to bring U.S. soybean ending stocks back into some sort of reasonable historical alignment.
LASTING CORN IMPRESSIONS: Should Corn Bulls surrender or simply retreat to fight another day? Retreat…I’m still supportive corn prices longer-term.
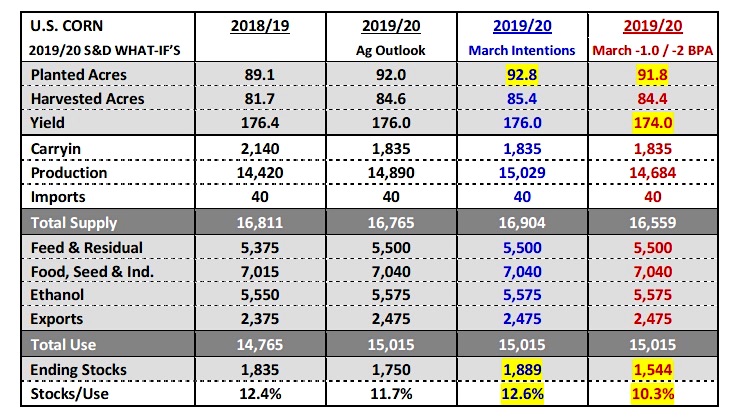
Even with planted acreage of 92.8 million acres the 2019/20 U.S. corn S&D still shows ending stocks below 1.9 billion bushels, and that’s assuming we get a national corn yield of 176 bpa. That type of yield with 44% of the expected acreage increase this spring coming in North and South Dakota is going to be a very tall task. Let’s also not forget that December corn futures have rallied well over $4.00 per bushel the last 3-crop years even with ending stocks forecasts much higher than 1.9 to 2.0 billion bushels early in the spring/summer.
The other thing to keep in mind is the Managed Money is already record short corn and I have to believe that record short position only increased (likely substantially) again on Friday.
I wouldn’t be surprised to see a Managed Money corn short approaching 280 to 290k contracts in nextFriday’s Commitment of Traders report (which will include today’s trading activity). At some point downward price momentum will stall and that’s when you never want to be the last one covering your short position.
There’s simply too much money sitting on one side of the market. Furthermore I wouldn’t expect commercial hedge paper to stop even 20 to 25-cent rallies from current price levels until the producer is forced to move corn in Jul/Aug/Sep. They’re going to need a much greater price incentive; not knowing how big (or small) their 2019 corn crop will be this fall. This begs the question who is going to sell corn to offset the eventual short Managed Money liquidation? Hang in there Corn Bulls.
May Corn Futures Trading Outlook
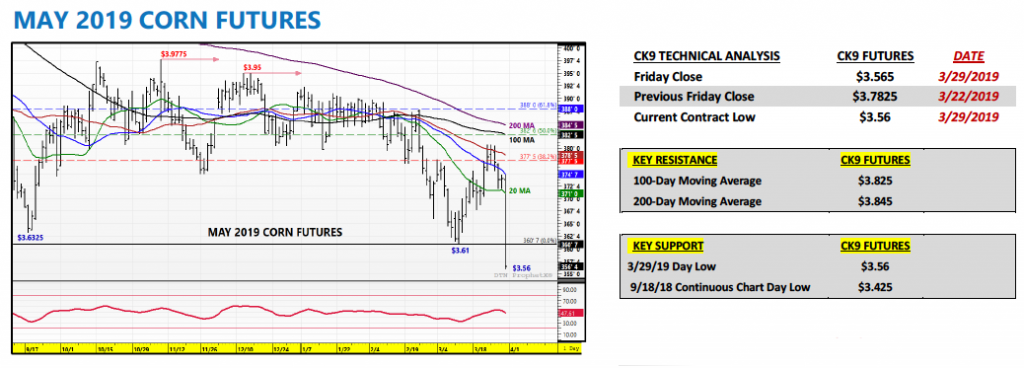
Obviously Friday’s price action accounted for most of the week’s losses; however…other key fundamental price drivers at the moment that I would argue are also slightly bearish short-term ABOVE $3.80 CK…
- U.S. ethanol production for the week ending 3/22/19 averaged just 975k barrels per day, down 29k bpd from the previous week and 27k bpd below the 4-week average. Since January 2018 there have only been 5-weeks total where U.S. ethanol production has averaged less than 1.0 million barrels per day.
- However despite the lower run-rate, U.S. ethanol stocks continued to move higher, increasing to a record high 24.448 million barrels. Reuters recently reported that a sixth of all U.S. ethanol production capacity had been shuttered due to massive flooding in the U.S. Midwest. This has also created logistical challenges, regarding the ability to move ethanol via rail to the coasts.
- Weekly export sales in corn totaled 35.6 million bushels for the week ending 3/21/2019. This moved crop year-to-date sales up to 1.679 billion bushels. And while U.S. corn export inspections/shipments remain 25% ahead of 2017/18, export sales now trail the previous crop year by 8%.
- This is a clear indication of world buyers shifting a greater percentage of their future corn needs to South America (Argentina and Brazil) with South American supplies stabilizing. Recalling again as well the USDA already lowered its 2018/19 U.S. corn export projection 75 million bushels in the March 2019 WASDE report to 2.375 billion bushels.
- March 1st, 2019 corn stocks totaled 8.60 billion bushels, which was down 3% from a year ago; however well above the average trade guess of 8.335 billion bushels.
- These figures were also released on Friday, which added to negative reaction in corn futures.
All things considering I still wouldn’t short CK9 below $3.50…I’m not changing my upward bias long-term. I might revise my longer-term upward price objectives; however it’s far too early to over-react to price breaks in Mar/Apr.
Twitter: @MarcusLudtke
Author hedges corn futures and may have a position at the time of publication. Any opinions expressed herein are solely those of the author, and do not in any way represent the views or opinions of any other person or entity.
Data References:
- USDA United States Department of Ag
- EIA Energy Information Association
- NASS National Agricultural Statistics Service


