U.S. equities continue to trade at all-time highs. The broader stock market trend is benefiting from strengthening market breadth. Meanwhile, excessive investor optimism continues to be a nagging concern.
Let’s breakdown the latest action in the equities market and share some important investing research with a look forward.
Key Takeaways: Strong market breadth offers a bullish offset to evidence of excessive investor optimism. Sentiment composites are nonetheless at levels where stocks have struggled to rally. Pessimism is weighing on the dollar, which is helping commodities and is a headwind for small-caps.
Rally Participation Remains Strong, Bull Market Carries On
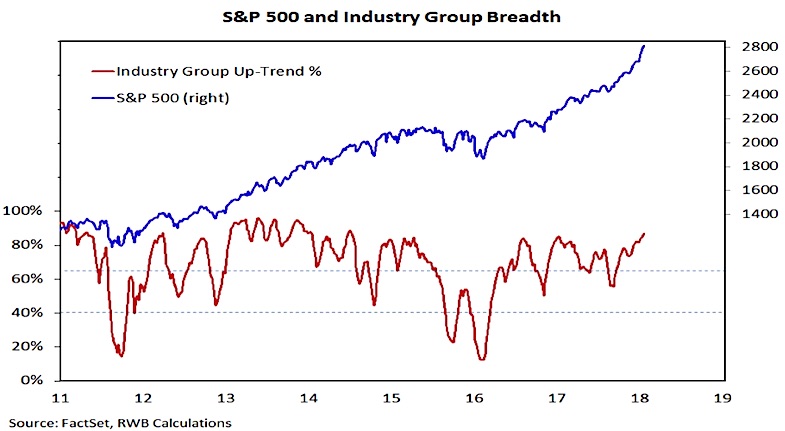
Last week, in this space, we suggested there may be cracks in the bullish market breadth façade (Breadth Strong, But Market Stresses Emerge), but at this point they are not sufficient to detract from the evidence that most areas of the stock market are trending higher. Our industry group trend indicator continues to move higher, rising this week to 87%. This is its highest level since 2014. Industry group trends have improved dramatically since bottoming near 55% in September. This suggests the stock market rally has seen increasing, not decreasing, participation in terms of industry groups in up-trends.
Supporting that view, the percentage of stocks in the S&P 500 making new highs has been climbing. The 10-day average of the percent of S&P 500 stocks making new highs less new lows has surged in 2018, rising to 23%, its highest level since 2013. For the small-cap S&P 600, this number is only 7%. Rally breadth is not nearly as robust when looking at small-caps.
The message from the sentiment indicators is one of caution, but the breadth (and trend) indicators suggest that the path of least resistance may still be higher. Evidence of a change in character in the rally (and/or evidence that central bank policy has become more hostile) would make excessive optimism a more immediate concern and could shift the overall Weight of the Evidence. To this, we are keeping a close eye on stock market momentum indicators, bond yields, and commodity prices (particularly Gold).
Investing / Trading Sentiment Indicators
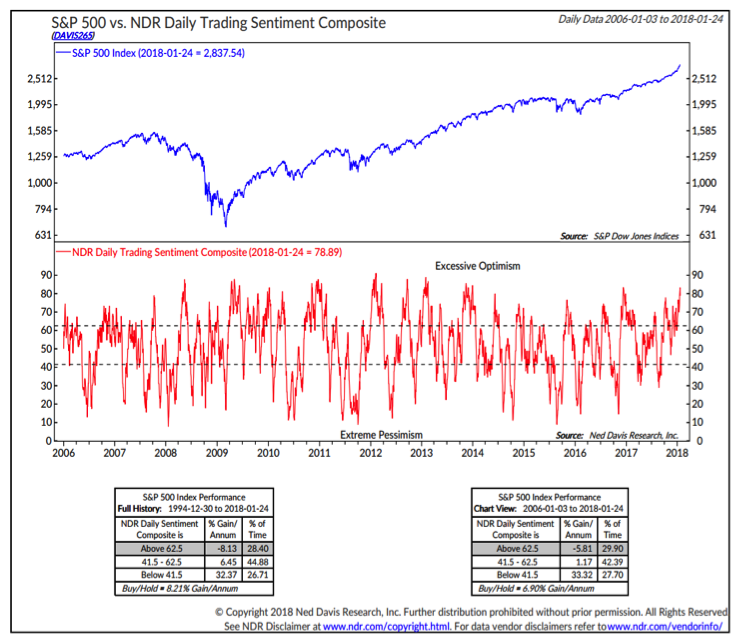
Every day, seemingly, a new sentiment indicator/story points to excessive optimism. Rather than be distracted by headlines and fall victim to confirmation bias (if we look for signs of excess, we will likely find it), our focus from a sentiment perspective is on a couple of composite indicators put together by Ned Davis Research. Both the Crowd Sentiment Poll and the Trading Sentiment Composite show optimism near record levels. The trading sentiment composite chart is shown below.
While it is true that excessive pessimism is better at identifying bottoms than optimism is at identifying tops, history still shows that stocks have struggled to sustain rallies in past instances when optimism has been at current levels. We can balance the sentiment message against the breadth data, but to discount it totally would be to suggest this time is different.
U.S. Dollar Weakness
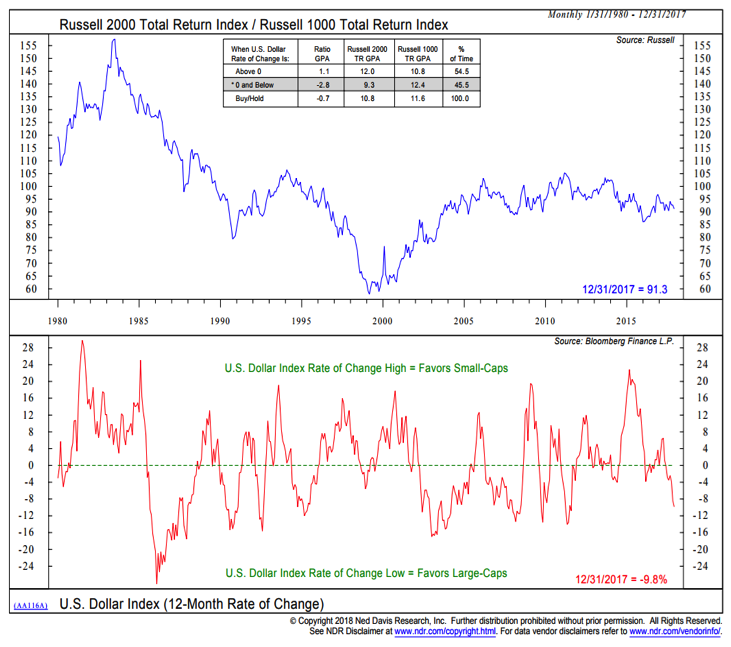
While sentiment data shows excessive optimism for stocks, it shows excessive pessimism for the U.S. Dollar. Contrary to stocks, the dollar tends to suffer in the face of widespread pessimism. That has been the case this week as the dollar moved to its lowest level since 2014. Reflecting this, commodities have continued to strengthen and the CRB commodity index has cleared resistance and broken out to its highest level since 2015.
Dollar weakness has not only spurred commodity strength, but it provides a bullish tailwind for large-caps at the expense of small-caps. With the Russell 2000 up nearly 4% in 2018, it might be hard to think about small-cap weakness. Small-caps, however, are losing pace on a relative basis, and versus large-caps they are approaching their August 2017 lows.
Thanks for reading.
Twitter: @WillieDelwiche
Any opinions expressed herein are solely those of the author, and do not in any way represent the views or opinions of any other person or entity.


