Stocks continue to trade at elevated levels, refusing to offer so much as a 3 percent dip for investors. Though the trend is still in tact, there are some concerns and market stresses in the underlying data.
Key Takeaways: With new high list expanding and an increasing percentage of industry in uptrends, breadth remains strong. There are some chinks however – new highs are more prevalent among large-caps than small-caps and broad market lacks upside momentum. With optimism elevated and bond yields drifting higher, near-term price trend for stocks could be facing a test.
Breadth Strong, But Not Without Flaws
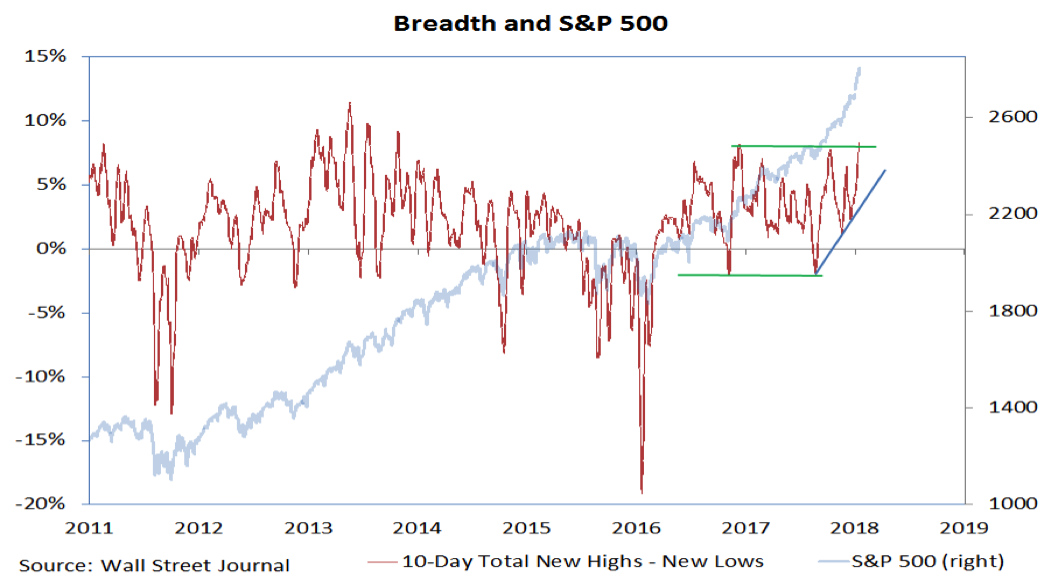
Last week saw the most new highs combined on the NYSE and NASDAQ since December 2016. That continued this week, with the 10-day total new highs less lows breaking out to its highest level since 2013. Add to this our industry group trend indicator surpassing its early-2017 peak and moving to its highest level since 2014 and it is hard to argue that the cyclical rally that emerged off of the early-2016 lows has carried the popular averages to new highs is suffering from a lack of broad market support.
A closer look, however, does show some chinks in the broad market’s armor. While the new high list at the large-cap level has expanded recently, among mid-caps and small-caps new highs remain relatively scarce. This week saw nearly one-third of the stocks on the S&P 500 making new 52-week highs, while less than 20% of the stocks on the mid-cap S&P 400 made new highs and only slightly more than 10% of the stocks on the small-cap S&P 600 made new highs.
For the S&P 500, this was the most new highs on a single day since early 2013. For the S&P 400 and 600, it was fewer new highs than were seen in November.
Another way to look at the broad market is to consider the ratio between advancing and declining issues. When this ratio, on a 10-day basis, exceeds 1.9, it typically signals strong broad market momentum (a so-called ‘breadth thrust’) which has historically been a reliable signal of gains for stocks going forward. In fact, of the 48 unique breadth thrusts over the past 70, only one has seen the S&P 500 one year later. Stocks have been buoyed by a series of breadth thrusts in recent years. In fact, every year from 2008 to 2016 saw at least one breadth thrust. Interestingly, for as strong as 2017 was in terms of stock market returns, it was the first calendar year since 2007 to not witness a breadth thrust. While breadth trends are still strong, this may be suggesting that longer-term broad market momentum has started to wane.
S&P 500 Up-Close
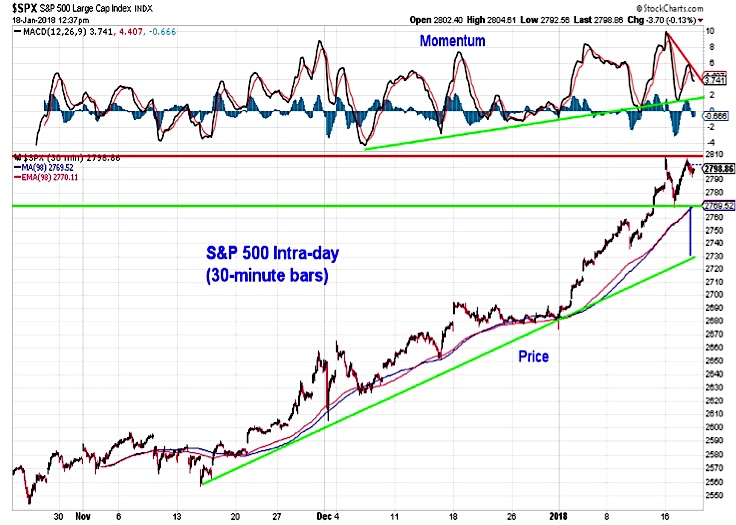
We are also seeing some evidence of waning short-term momentum on the S&P 500. While too early to make much of it right now, this week’s volatility allows us to note some levels of interest on the S&P 500. While the index itself moved back to its early-week peak, momentum has lagged and is now drifting lower. This could mean a test of the momentum up-trend that emerged in December and makes this week’s low (near 2769) a potential important support level. A break there could mean a quick move to test support near 2730.
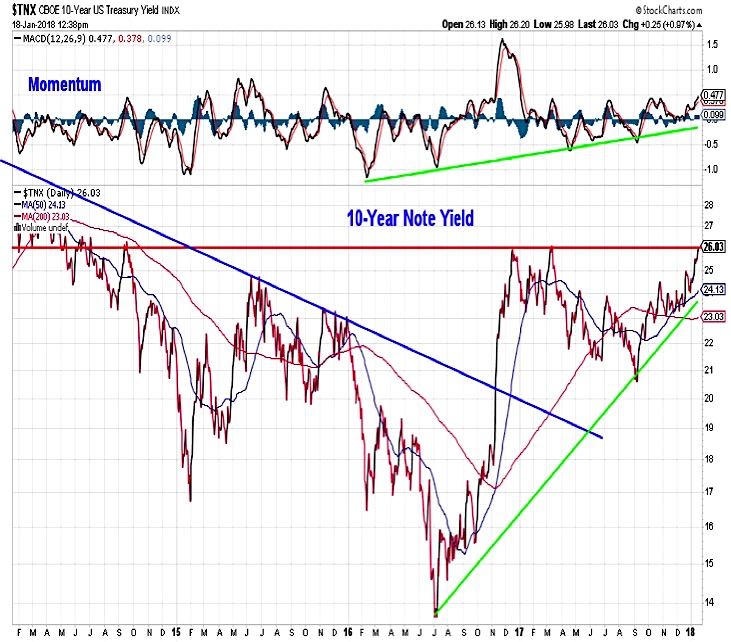
Also moving this week has been the yield on the 10-year T-Note. Momentum there continues to move higher and the yield is now approaching the late-2016/early 2017 highs just above 2.6%. Because of the intense focus on this level, it seems unlikely that the yield will remain here for long. More likely would be a quick move up toward 3.0% or a reversal toward 2.1%. With momentum rising and German bond yields drifting higher as well, the more likely scenario would seem to be a test of 3.0%.
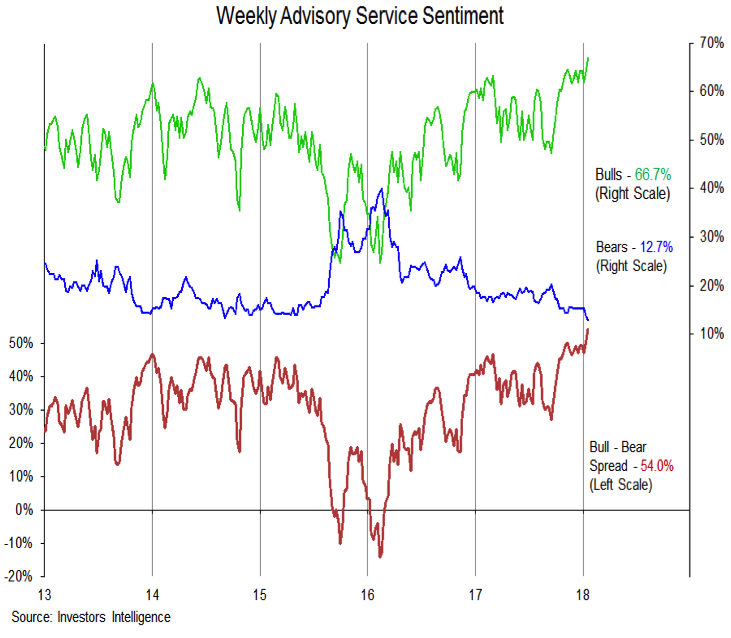
This week has also seen additional evidence of widespread optimism among investors. Grabbing the headlines was data from Investors Intelligence that showed the most bulls and fewest bears since 1986.
The NAAIM Exposure index soared 30 points this week and median equity exposure on that survey moved back toward the top of its recent range (the median respondent has equity exposure of 97%). The 10-day CBOE put/call ratio has dropped to its lowest level since 2014 as demand for protective puts has evaporated. Survey data from Bank of America showed hedge funds with the most exposure to equities since 2006 and a sharp collapse in the percentage of investors with downside protection. Overall, the sentiment data paints a picture of optimism and complacency that suggests near-term risks are elevated.
Thanks for reading.
Twitter: @WillieDelwiche
Any opinions expressed herein are solely those of the author, and do not in any way represent the views or opinions of any other person or entity.


