Investor Sentiment is a bearish indicator.
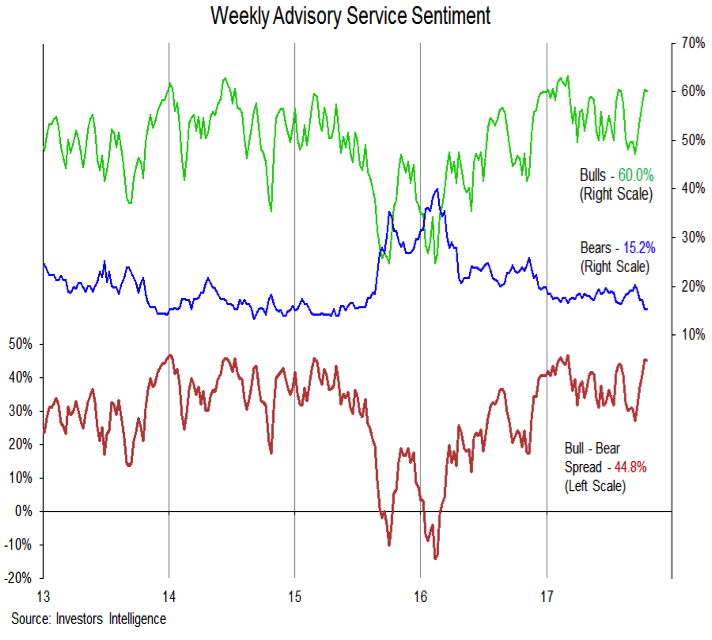
Investor optimism is excessive by most measures. The latest survey of advisory services shows four bulls for every bear, a near-record level of optimism.
Data from the NAAIM (National Association of Active Investment Managers) over the past month showed that even the bearish investment managers in its sample had elevated exposure to stocks. At one point, the data showed that the most bearishly positioned managers was at 80% equity exposure (the highest such reading on record). That has now started to unwind, but the survey data remains largely devoid of evidence of skepticism or pessimism.
Another way of measuring optimism comes from the University of Michigan’s survey of consumers. As of the end of September, 65% of respondents expected stocks to be higher in one year. This surpasses the peaks seen in 2015 and 2007 and is at a level that has not been conducive to continued stock market strength.
Providing some offset to this evidence of widespread optimism has been continued elevated levels of partisanship and policy uncertainty. While these may keep the sentiment data from signaling euphoria (which does indeed seem to be lacking), optimism is nonetheless high enough to make the path forward for stocks somewhat rocky. Some degree of price consolidation could help take some of the air out of the sentiment balloon.
Seasonal patterns and trends have turned bullish. Both the one-year cycle and the four-year cycle suggest that the uptrend in stocks could gain strength moving into year end. These trends are favorable on their own, but conditions specific to 2017 may have even greater significance. There are many ways to describe the relative lack of volatility seen this year, but the bottom line is that it tends to allow stocks to extend their gains. Also, history shows that when stocks are up through the first three quarters of the year and are making new highs in September, the fourth quarter tends to be strong. This is not to say that stocks cannot hit a rough patch between now and year end, but rather to suggest that the path of least resistance over the course of the quarter as a whole is likely to be higher.
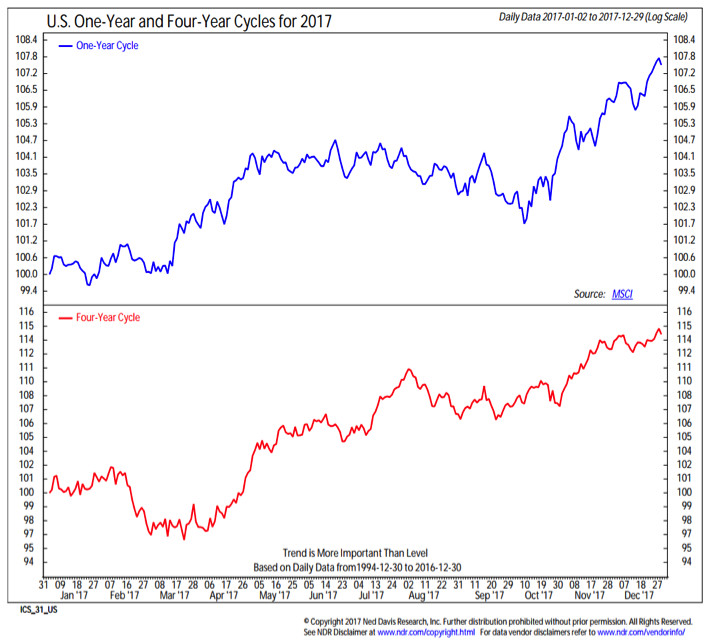
Looking ahead, the bullish seasonal tailwind that stocks enjoy heading into 2018 may be relatively short-lived. The weakest periods for stocks in the four-year cycle tends to be heading into elections. The 2018 mid-term elections are shaping up to be particularly contentious (even perhaps more so than is typically seen in the first term for a new presidency). When viewed in context of potential changes in central bank policy and/or a move higher in bond yields, the low volatility experience of 2017 should be viewed as a gift to be enjoyed, not a new normal to be expected. The good news is that with volatility comes opportunity. (source: Ned Davis Research)
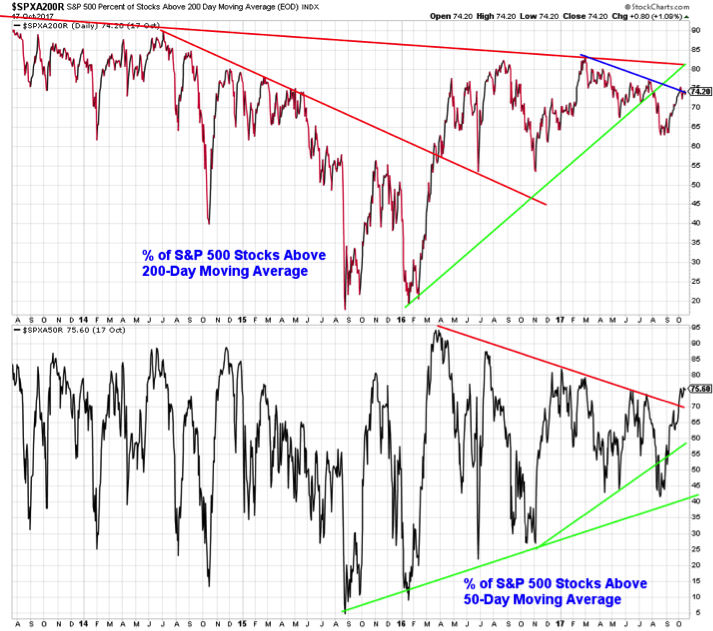
Breadth remains bullish. The improved behavior of the broad market over the past month is encouraging, but not without blemishes. After bottoming near 40% in August, the percentage of stocks trading above their 50-day averages has surged to 75%, breaking through a down-trend of lower highs. While this could provide some near-term momentum for stocks, the longer-term trends have struggled to see similar improvement. The percentage of stocks trading above their 200-day averages has climbed from 63% to 74%, but the pattern of lower highs has not been broken. Broad market trends are moving in a positive direction, but a failure to see continued strength and a confirmation of the highs being made by the S&P 500 could weigh on stocks next year.
Thanks for reading.
Twitter: @WillieDelwiche
Any opinions expressed herein are solely those of the author, and do not in any way represent the views or opinions of any other person or entity.


