In soybeans, 2015/16 World ending stocks decreased marginally to 82.58 MMT versus 82.86 MMT in November and 77.66 MMT in 2014/15. Both Brazil and Argentina’s soybean production estimates were unchanged at 100 MMT and 57 MMT respectively.
The only notable adjustment was a 0.50 MMT increase to Argentina’s projected soybean exports, which improved to 11.25 MMT for 2015/16 compared to 10.57 MMT a year ago and just 7.84 MMT in 2013/14.
China, the world’s largest soybean importer representing nearly 64% of all global imports, saw its import projection unchanged at 80.5 MMT. Overall, the December WASDE report was essentially a complete non-factor, only serving to reaffirm that U.S. and World corn and soybean carryout levels remain more than adequate.
COMMITMENT OF TRADERS REPORT: CORN
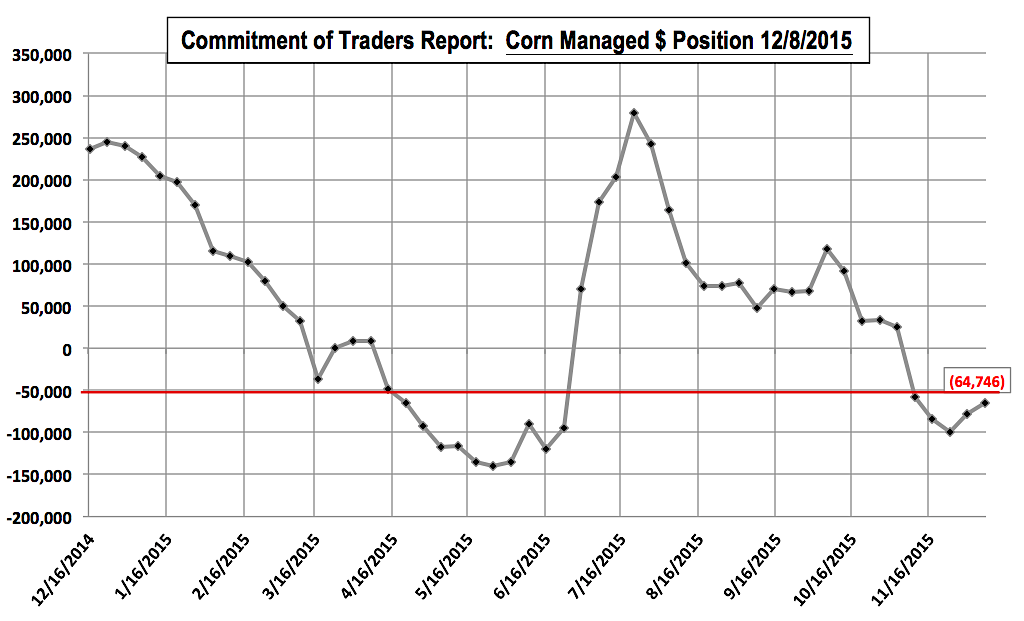
The latest Commitment of Traders Report with updated positions as of 12/8 showed the Managed Money net short position in corn decreasing by 13,393 contracts week-on-week to -64,746 contracts. What has to be somewhat discouraging for Corn Bulls however is that despite Money Managers reducing their net short corn position exposures by just over 35,000 contracts from 11/18 through 12/8, March corn futures managed just a 5 ½-cent per bushel higher close over that timeframe (November 18th CH6 close of $3.68 ¼ versus December 8th close of $3.73 ½). Therefore that buy paper hasn’t necessarily translated into a material move higher for corn prices, which isn’t inconsistent in crop years with record to near record corn production. The reality is even small rallies are being used by producers to price bushels that need to be sold prior to calendar year end. This commercial “hedge” paper will likely continue to act as another layer of overhead resistance, offsetting a percentage of the continuing paper shift in the Managed Money position.
#NoFilter: PRICE FORECAST: MARCH CORN FUTURES
March corn futures closed down 4-cents per bushel on Friday finishing at $3.75 ¼. In fact as of the close on December 11th, CH6 futures were trading just 3-cents higher versus the month-end close on November 30th ($3.72 ¼). Upward momentum has routinely stalled at the 35 and 50-day moving averages, positioned at $3.767 and $3.821 respectively. The U.S. corn S&D continues to foil Corn Bulls following yet another increase to 2015 U.S. corn ending stocks in Wednesday’s December WASDE report.
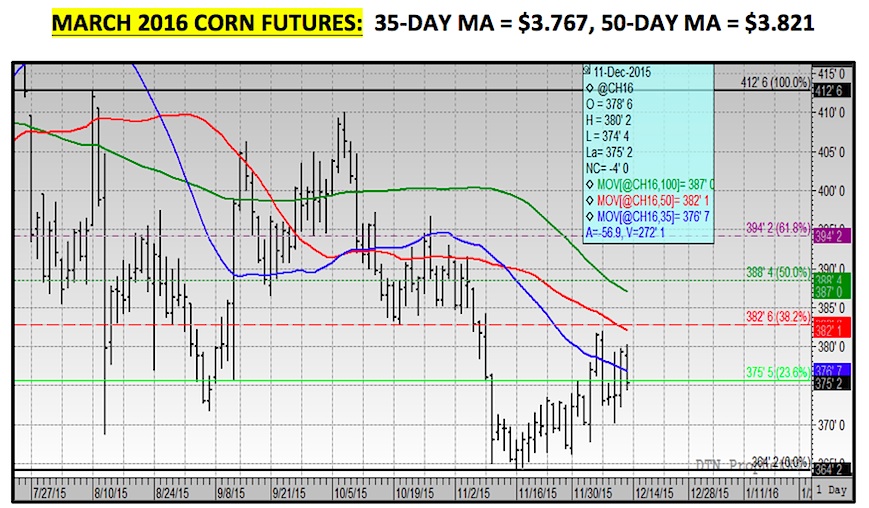
Furthermore, I’m inclined to believe traders will be anticipating another U.S. corn yield increase in the January WASDE report with the trend in the national yield higher since October. US corn-ethanol demand has performed evidenced by a near record 4-week average industry run-rate of 983,000 barrels per day; however I’m not sure even that will be enough to offset continued disappointing export demand, as well as, the possibility of a US corn production increase looming in January.
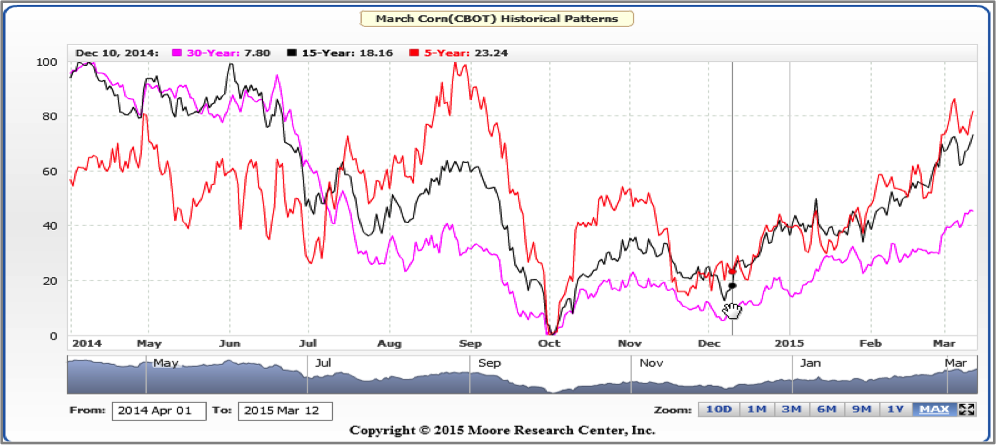
The one positive for Corn Bulls remains the price seasonality heading into Q1 2016, which is higher for March corn futures on the 5, 15, and 30-year patterns (see below). However a “rally” can be defined by as little as 10-cents per bushel depending upon on the underlying market fundamentals.
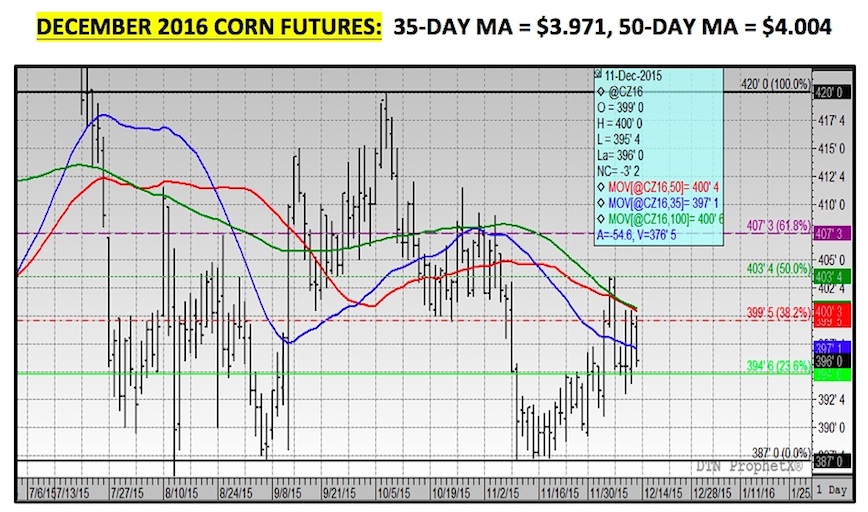
For reference: December 2016 Corn Futures
Thanks for reading.
Twitter: @MarcusLudtke
Any opinions expressed herein are solely those of the author, and do not in any way represent the views or opinions of any other person or entity.
Data References:
- USDA United States Department of Ag
- EIA Energy Information Association
- NASS National Agricultural Statistics Service

: Worrisome to Broader Market?")

