Positive seasonality patterns appear to be playing out as Corn futures prices continue to receive a bid. The greater question for traders and farmers is how long will the rally last. And does it have staying power?
Let’s start by reviewing the December WASDE report, then move on to the COT report, corn seasonality, and current price action for corn futures.
December 2015 WASDE Summary:
The USDA made only limited adjustments to the 2015/16 US corn and soybean balance sheets in the December Crop report released on Wednesday.
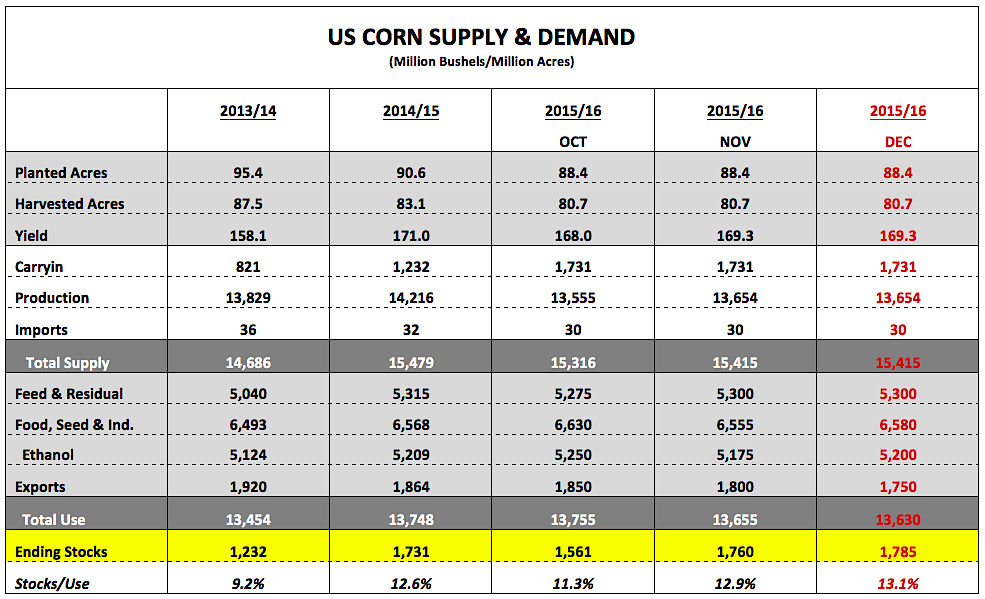
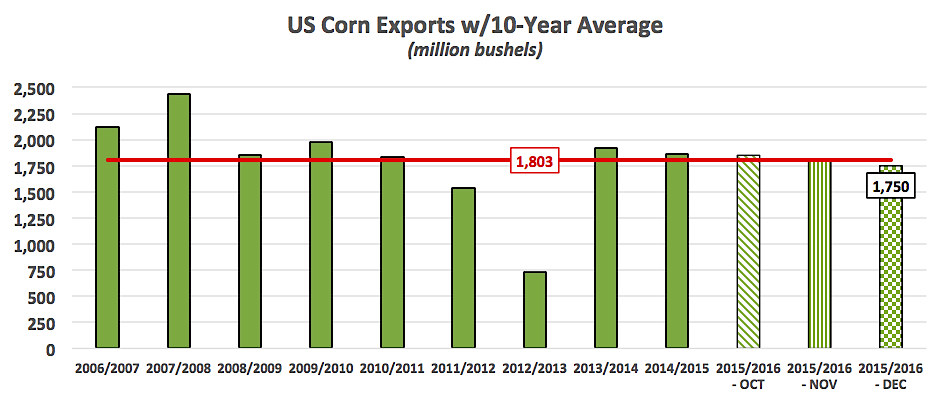
For corn the USDA lowered exports 50 million bushels for the second consecutive month. 2015/16 US corn exports were revised down to 1,750 million bushels versus 1,864 million a year ago and the 10-year average of 1,803 million. Conversely, the December WASDE report saw the USDA raise US corn-ethanol demand 25 million bushels to 5,200 million versus 5,209 million in 2014/15 and the 10-year average of 4,366 million. The net demand changes resulted in US corn ending stocks improving to 1,785 million bushels versus 1,760 million in November and the average trade guess of 1,768 million.
For soybeans, the USDA made absolutely no changes versus a month ago with US soybean ending stocks holding steady at 465 million bushels, which was 3 million bushels higher than the average trade guess. It should be noted that the USDA does not adjust production in the December WASDE report. Therefore the USDA’s final revisions to the 2015/16 US corn and soybean production forecasts will be made in the January report, which will be released on 1/12/16.
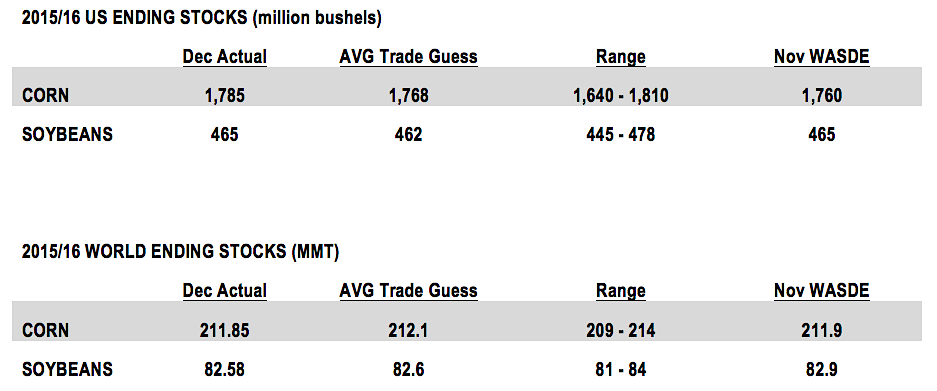
The World supply and demand figures also offered very few surprises. 2015/16 World corn ending stocks were lowered slightly to 211.85 MMT. Corn production estimates for China, Brazil, Argentina, and Ukraine were all unchanged versus November. Of those four key corn producing countries, Brazil continues to draw the most uncertainty regarding the production potential of its second or “safrinha” corn crop, which typically isn’t planted until February following the harvest of early maturing soybeans.
Brazil’s second corn crop accounts for over 60% of its total crop year corn production with the majority of those bushels finding their way into the export market. Given Brazil’s current standing as the 2nd largest corn exporter in the world, any negative planting adjustments to the safrinha corn crop will likely have a material impact on the global corn export balance. Brazil’s 2015/16 corn exports were estimated at 25 MMT in the December Crop report; however that total has varied from a low of 21 MMT (533 million bushels) to a high of 32 MMT (1,260 million bushels) in just the last 3 crop years. Therefore there is the possibility for US corn exports to improve later in the marketing year if Brazil’s second corn crop experiences minor acreage contraction (due to low world corn prices) and/or below-trend corn yields (due to less than favorable growing conditions).
continue reading on the next page for price analysis and forecasts…

: Worrisome to Broader Market?")

