U.S. Corn Futures Price Forecast (CZ6)
* U.S. Corn Exports Strong *
It was yet another strong week for U.S. corn export business. On Monday the USDA reported U.S. corn export inspections for the week ending September 29th, 2016 of 57.9 million bushels. Additionally, crop year-to-date (2016/17) U.S. corn shipments improved to 226.7 million bushels versus just 128.0 million the previous year, representing a 77% increase. Thursday’s U.S. corn export sales were even more impressive at 81.1 million bushels. Crop year-to-date corn sales improved to 811.1 million bushels versus just 434.4 million a year ago (+87%). If there were any lingering concerns over last week’s announcement of China approving 2 MMT of corn for export potentially displacing U.S. corn sales, I think they’ve been shelved for the time being.
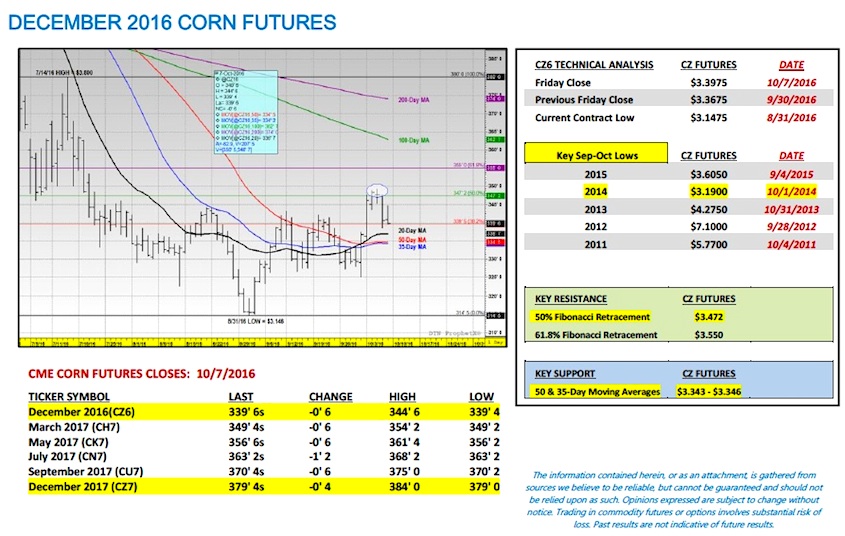
KEY CZ6 PRICING CONSIDERATIONS FOR THE WEEK ENDING 10/7/2016:
December 2016 corn futures closed higher on the week due in large part to an aggressive 9 ¼-cent higher close on Monday. However as I alluded to in last week’s commentary the 50% Fibonacci retracement at $3.47 ¼ essentially proved to be the stopper on this week’s up move. In my opinion additional rallies above this week’s day highs of $3.49 to $3.49 ¼ back up to $3.55 (61.8% Fibonacci retracement) and/or $3.627 (100-Day Moving Average) will now prove difficult for the following 2 reasons:
Informa Economics joined the chorus of notable private analysts still projecting a U.S corn yield above 174 bpa late in the week, offering an official October U.S. corn yield forecast of 174.5 bpa (and 51.6 bpa for soybeans). Therefore there are plenty of big crop estimates still weighing on futures prices…especially in soybeans where harvested yield results in excess of 60 to 65 bpa have become common place.
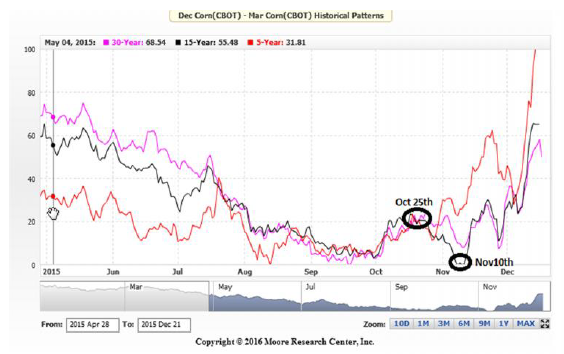
Note the December corn futures seasonal below. The 5, 15, and 30-year patterns all suggest a sideways to slightly higher pricing pattern into October 25th before turning decidedly lower in both the 15 and 30-year patterns through approximately November 10th.
Overall, I still view rallies in CZ6 as selling opportunities into the October 25th seasonal high. I do NOT believe this year’s pricing pattern is consistent with the 5-year trend after October 25th.
Thanks for reading.
Twitter: @MarcusLudtke
Author hedges corn futures and may have a position at the time of publication. Any opinions expressed herein are solely those of the author, and do not in any way represent the views or opinions of any other person or entity.
Data References:
- USDA United States Department of Ag
- EIA Energy Information Association
- NASS National Agricultural Statistics Service

: Worrisome to Broader Market?")


