Private October U.S. Corn yield estimates remain strong. FCStone, as well as other notable private forecasters, issued their October 2016 corn yield estimates this week in advance of the USDA’s release of its October 2016 Crop Production and WASDE reports next Wednesday (10/12). FCStone issued U.S. yield projections of 175.2 bushels per acre for corn (total production of 15,163 million bushels) and 52.2 bushels per acre for soybeans (total of production of 4,357 million bushels).
This compares to the USDA’s September 2016/17 U.S. corn yield estimate of 174.4 bpa (total production of 15,093 million bushels) and U.S. soybean yield estimate of 50.6 bpa (total production of 4,201 million bushels).
I recalibrated my October 2016 corn yield estimate (U.S) this week taking into consideration current crop condition ratings by state, as well as, early harvested yield results in the Eastern Corn Belt (which in general have been exceptional). My findings resulted in a U.S. corn yield forecast of 172.4 bpa, which was up slightly from my projection a month ago; however still 2 to 3 bpa below both the USDA and FCStone.
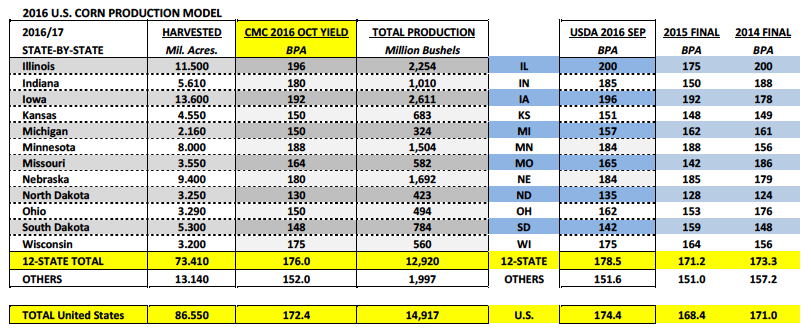
Where I differ from the majority still comes back to my unwillingness to project record to near record corn yields for ALL top five U.S. corn producing states. In September the USDA issued the following 2016 corn yield estimates by state for the top five corn producers (in order of total production greatest to least): Iowa 196 bpa versus its current record yield of 192 bpa (2015), Illinois 200 bpa versus its current record yield of 200 bpa (2014), Nebraska 184 bpa versus its current record yield of 185 bpa (2015), Minnesota 184 bpa versus its current record yield of 188 bpa (2015), and Indiana 185 bpa versus its current record yield of 188 bpa (2014). As you can see the USDA’s literally betting the farm on the U.S.’s biggest corn producers nearly running the table on record corn yields in 2016.
That said…I’m not ready to go all-in on that type of yield performance across ALL FIVE of those states for three primary reasons.
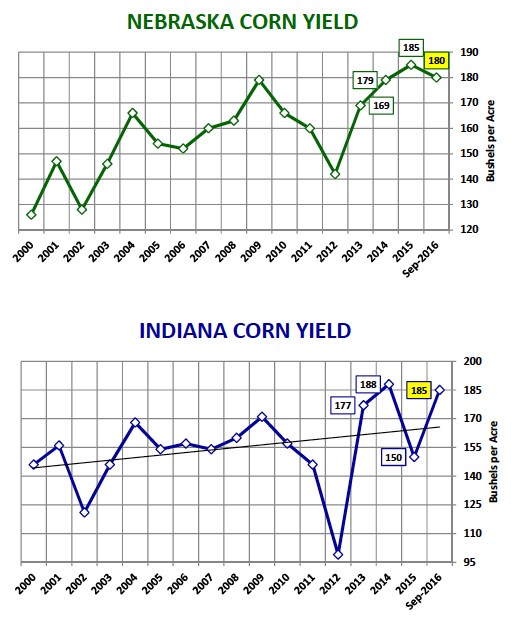
1. Nebraska’s corn crop is currently rated 73% good-to-excellent, which is slightly lower than last year’s record-setting performance. Additionally, Nebraska stood out among the major states the Pro Farmer Midwest Crop Tour sampled back in August for its disappointing irrigated corn yield results. Pro Farmer issued a corn yield estimate for NE of 179 bpa at that time. I currently have Nebraska at 180 bpa, 4 BPA below the USDA’s September forecast and 5 BPA below Nebraska’s record corn yield from 2015. If realized my forecast would still be NE’s 2nd best corn yield ever.
2. Indiana’s corn crop is currently rated 71% good-to-excellent, 7% LOWER than its record-setting performance from 2014, which resulted in a final state yield of 188 bpa. Once again, Pro Farmer’s tour samples offered mixed yield results specifically in eastern Indiana. This led to Pro Farmer estimating IN’s corn yield at 174 bpa. At present I have Indiana at 180 bpa versus the USDA’s September forecast of 185 bpa and 2014 record yield of 188 bpa. If realized my forecast would still be IN’s 2nd best corn yield ever.
3. In the September 2016 WASDE report the USDA was projecting record ear weights and the 3rd highest ear count ever. History has shown that it’s very hard to achieve record to near record figures in both categories during the same crop year. For this reason I still believe over time (in both the November and January WASDE reports) ear weights in particular will decrease, which SHOULD reduce top end yield performance by 1 to 3 bpa.
Therefore of the top 5 corn producing states in the country I’m still projecting a record yield in MN (equal to 2015) and the 2nd best yields ever in the other 4 states; however my figures are simply a few bpa BELOW the USDA’s September estimates. Those subtle variances equate to the difference between a final U.S corn yield of 172.4 bpa versus 174.4 bpa (total production differential equals -176 million bushels).
Weekly Crop Progress Report Shows Corn Harvest on Track
Monday’s Weekly Crop Progress report showed the U.S. corn harvest improving to 24% as of October 2nd, which was equal to last year’s pace and just 3% behind the 5-year average. Illinois’s corn harvest was estimated at 43% versus 44% a year ago and its 5-year average of 38%. Indiana’s corn harvest was estimated at 24% versus 26% a year ago and its 5-year average of 21%. Iowa and Minnesota’s corn harvests were just getting underway forecasted at 10% and 8% respectively.
continue reading on the next page [corn futures price forecast] …

: Worrisome to Broader Market?")

