December corn futures traded lower by 1 CENT per bushel week-on-week, finishing Friday at $3.56 1/4.
Let’s review the latest news, data releases, and market trends with an eye on the week ahead (October 1).
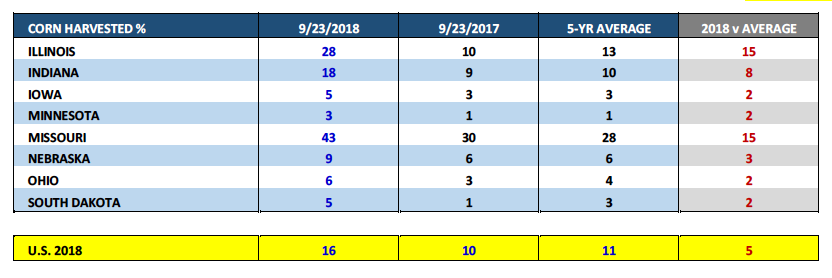
Monday’s Weekly Crop Progress report showed the U.S. corn harvest improving to 16% versus 10% a year ago and 11% on average as of the week ending September 23rd.
Illinois’s corn harvest was reported at 28% versus 10 % in 2017 and 13% on average. Illinois in particular, remains a key focal point for corn traders, as they try to assess just how well the USDA’s record state corn yield projections in the September Crop Production report hold up through harvest.
In September the USDA estimated Illinois’s corn yield for 2018 at an incredible 214 bpa, +13 bpa higher than the previous record established in 2017.
What has the early harvested corn in IL shown thus far? The word being used this week to describe Illinois’s early corn yield results is “variable.” What does “variable” mean? I take that to mean some good-to-great corn and some average. However if that’s the case I’m still not sure how that translates to a state-wide average corn yield of 214 bpa. Furthermore the word “variable” is also being applied to early yield results in Minnesota and Iowa. The market will be watching closely to see if this trend continues as the U.S. corn harvest accelerates. Privately I’ve seen various trade circles lowering their national corn yield estimates back under 180 bpa.
Corn Bulls likely couldn’t be happier with the start to the 2018/19 U.S. corn export sales and inspections fall campaign.
Weekly U.S. corn export sales for the week ending September 20th, 2018/19 totaled 67.4 million bushels bringing crop year-to-date export sales up to 719.2 million bushels. This is an increase of 272.4 million bushels (or +61%) versus 2017/18. Cumulative U.S. corn export inspections are also 47% higher than a year ago. In the September 2018 WASDE report the USDA forecasted 2018/19 U.S. corn exports of 2.400 billion bushels versus 2.425 billion bushels in 2017/18. I believe the USDA will have to strongly consider raising their export forecast in the October WASDE report due to an aggressive, early sales and inspections pace.
The U.S. continues to benefit from Brazil’s 2017/18 corn crop falling nearly 17% below 2016/17. Brazil has traditionally been the world’s 2nd largest corn exporter; however it’s looking more and more like Brazil will struggle to compete with the U.S. in the world export market until they’re able to re-fill their supply chain following their 2018/19 safrinha corn harvest (which won’t be until June/July 2019).
On Friday the USDA released its September Grain Stocks report. In that report Sep 1 Corn Stocks were estimated at 2.140 billion bushels. This was substantially higher than the average trade guess of 2.010 billion bushels.
Essentially what that will do is raise the USDA’s 2017/18 U.S. corn ending stocks figure to 2.140 billion bushels in the October 2018 WASDE report versus its September forecast of 2.002 billion bushels. In turn this will also then increase 2018/19 U.S corn carryin stocks by 138 million bushels month-on-month. Corn futures immediately reacted negatively to the USDA’s stocks revisions.
It should also be noted that the USDA’s Sep 1 soybean stocks projection was also higher than expected coming in at 438 million bushels versus the average trade guess of 401 million and the USDA’s latest 2017/18 U.S. soybeans ending stocks forecast of 395 million bushels.
The last thing the soybean market needs right now is higher 2018/19 U.S. soybean carryin stocks with ending stocks already forecasted at a record high 845 million bushels as of the September 2018 WASDE report.
DECEMBER CORN FUTURES OUTLOOK
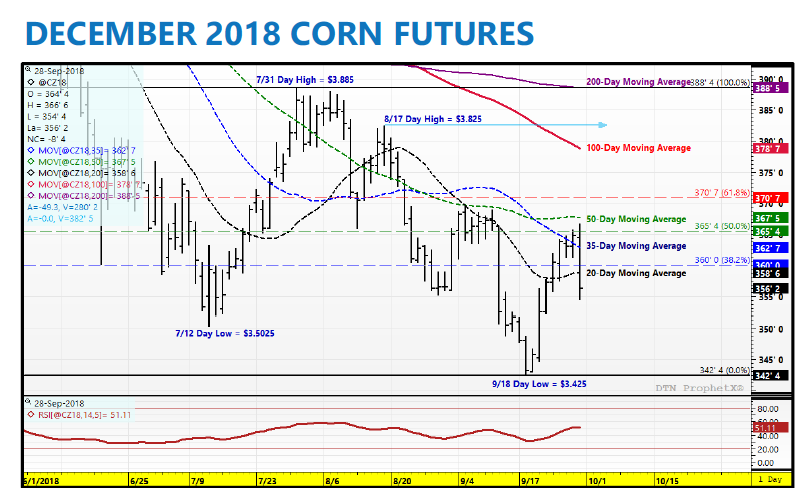
December corn futures looked poised to finish the week with an encouraging close for Corn Bulls over the 35-day moving average of $3.627. In fact early in Friday’s session CZ18 traded up to a day high of $3.66 ¾, marking its highest tick since the publication of the USDA’s September 2018 WASDE report. However it proved all for not following the release of the USDA’s September Grain Stocks report, which came out midway through Friday’s session at 11:00 a.m. CST.
In that report the USDA offered sharply higher than expected Sep 1 stocks estimates for both corn and soybeans. Red figures immediately ensued for both markets; ending with CZ18 closing down 8 ½-cents per bushel on 9/28 at $3.56 ¼.
Friday’s market once again showed just how fragile the recent up moves in both corn and soybeans have been over the last 8-trading sessions. Technically CZ18 was within a penny of potentially closing over the 50-day moving average ($3.675), which if realized would have likely resulted in corn rallying another 8 to 10-cents (100-day moving average = $3.787). Now price momentum has seemingly shifted back to sideways to lower.
The most recent Commitment of Traders report showed Money Managers reducing their net short position 28,497 contracts week-on-week as of Tuesday’s closes (net short = -112,779 contracts). However my guess is the short-covering ended with Friday’s Sep 1 stocks report with new selling now taking over.
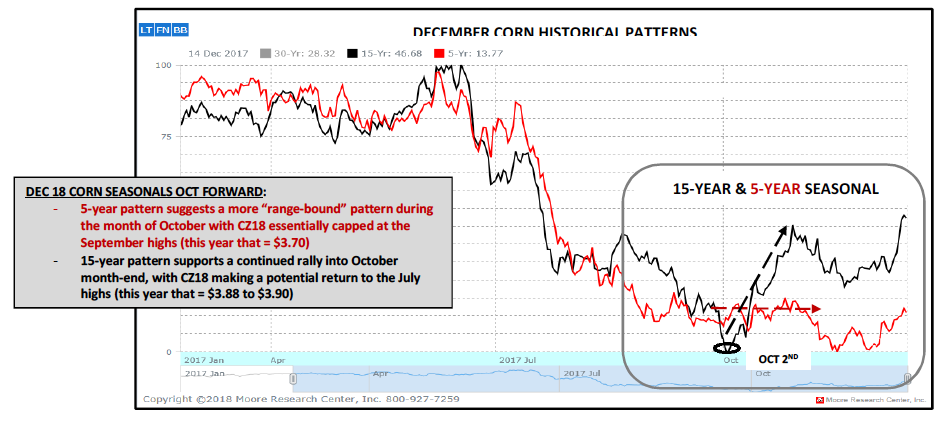
Heading into next week I see the market as range bound (more in-line with the 5-year seasonal); trading between $3.45 and $3.65. For CZ18 to break out of that range to the upside Corn Bulls will likely need the USDA to LOWER the U.S. corn yield in the October 2018 WASDE report 1 to 2 BPA (released on 10/11).
Twitter: @MarcusLudtke
Author hedges corn futures and may have a position at the time of publication. Any opinions expressed herein are solely those of the author, and do not in any way represent the views or opinions of any other person or entity.
Data References:
- USDA United States Department of Ag
- EIA Energy Information Association
- NASS National Agricultural Statistics Service

: Worrisome to Broader Market?")

