December corn futures closed UP 1 ½-cents per bushel week-on-week, finishing at $3.56 ¾ on Friday.
Corn bulls continue to defend the $3.50 price support area. But they are in need of a script-altering catalyst if prices are to sustain any rally attempt. Fundamentally, the corn market remains mixed.
WEEKLY HIGHLIGHTS: September 5 – 8
- Last Monday’s Weekly Crop Progress report showed the U.S. corn good-to-excellent rating falling 1% week-on-week to 61% versus 74% in 2016. South Dakota’s good-to-excellent rating declined 4% on the week, with North Dakota and Michigan both off 2%. The offset to those state decreases was a 2% improvement in both Illinois’s and Iowa’s good-to-excellent ratings (the U.S.’s top 2 state corn producers). Overall we’re getting to the point in the growing season where traders are less and less concerned/reactive to minor changes in both state and national good-to-excellent ratings. The reality is with 60% of the U.S. corn crop now dented as of September 3rd and 12% “mature” the primary concern moving forward is an early frost. Currently NOAA’s 6 to 10-day forecast continues to show no signs of an imminent frost for the Midwest, although below-normal temperatures are expected for the Eastern Corn Belt.
- Private U.S. corn yield estimates for September continue to come in higher than what many were projecting a month ago. Informa’s yield forecast was raised to 169.2 BPA versus its estimate of 165.9 BPA in August. Meanwhile FCStone countered with a U.S. corn yield forecast of 166.9 BPA versus its estimate of 162.8 BPA last month. And while both estimates are below the USDA’s August figure of 169.5 BPA; the key takeaway is the vast majority believe the U.S. corn crop got bigger, not smaller during the month of August due to the return of cooler temperatures and increased precipitation.
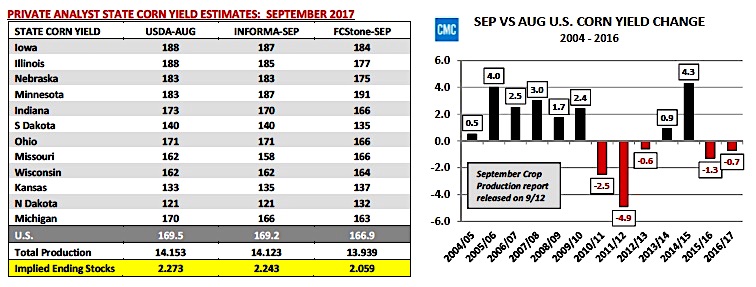
- NASS will release its September Crop Production report next Tuesday, September 12th. Over the past 13-years (2004-2016) the USDA has lowered the U.S. corn yield in the September report on 5 separate occasions. The largest decrease was -4.9 BPA in 2011/12; the average decrease has been -2 BPA. Clearly Corn Bulls will be cheering for a 2011/12 type yield reduction, which would equate to a U.S. corn yield of 164.6 BPA. That said I believe the probability of a yield cut greater than 2 BPA is extremely low. And though I would content both Iowa’s and Illinois’s final state corn yields will settle closer to 180 BPA this year (versus the USDA’s August forecast of 188 BPA for both), I don’t think we’ll see those yields reflected until the November or January reports.
December Corn Futures PRICE OUTLOOK:
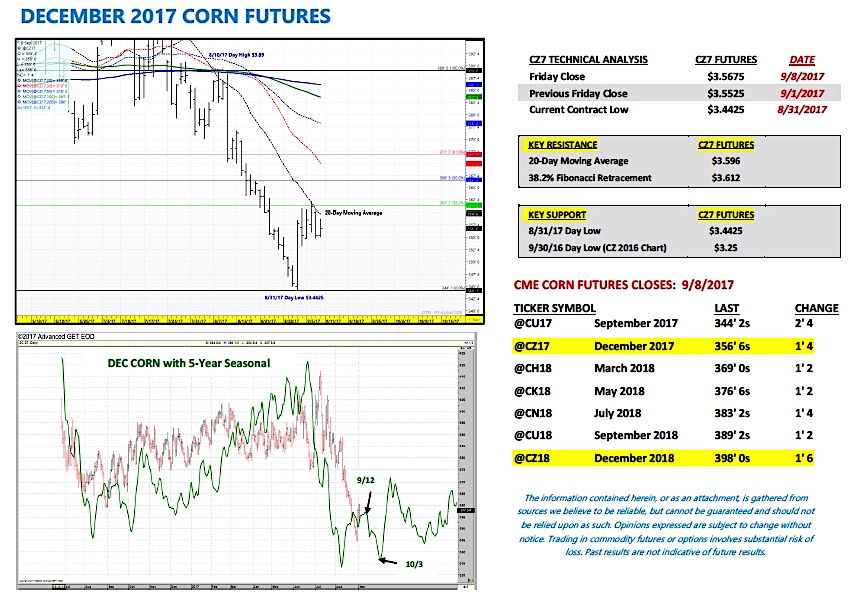
Price action in December corn futures Tuesday and Wednesday featured futures prices building on the previous week’s gains. December corn traded up to a day high (and week high) of $3.62 per bushel on Wednesday, 9/6; however ultimately futures were unable to push through and close above key price resistance at both the 20-day moving average and 38.2% Fibonacci retracement ($3.612). On Thursday this resulted in December corn futures setting back 5 ¾-cents bushel on the day. Friday corn futures recovered slightly, which allowed for a 1 ½-cents per bushel higher weekly close at $3.56 ¾. Overall last week’s price action largely reinforced that 20 and 30-cent rallies off of the current contract low of $3.44 ¼ won’t be easy barring a Bullish yield/ending stocks surprise in the September WASDE/Crop Production reports next Tuesday, 9/12.
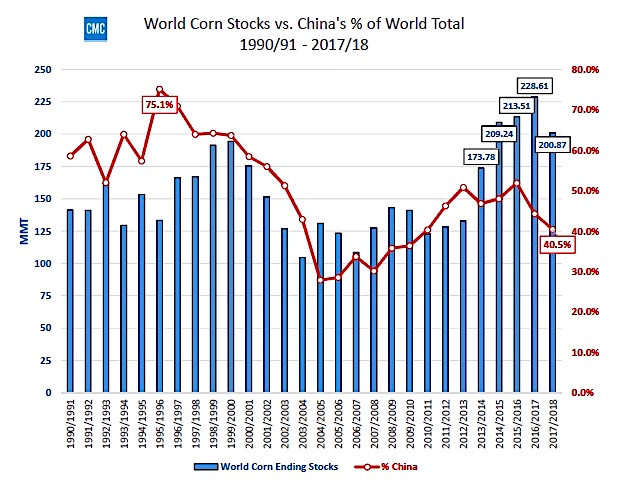
What’s the other negative, long-term market fundamental? Not only do U.S. corn stocks remain burdensome, so do World inventories. 2017/18 World corn stocks are currently projected at 201 MMT, down 28 MMT from a year ago; however 9 MMT ABOVE the prior 5-year average of 192 MMT. Additionally China’s corn ending stocks represent 40.5% of total World corn stocks down from 44.3% in 2016/17. What does this imply? Traditionally China’s corn stocks have been considered unavailable to the world market irrespective of demand or price (meaning high Chinese stocks can distort the perceived cushion of a high World corn stocks figure). Therefore for 2017/18 this would suggest that a greater percentage of World corn stocks are currently being held by countries who have the ability to respond to the appropriate price responses/incentives should exporters seek additional bushels. This should be considered another price resistance factor on rally attempts back to $3.80/$3.90 in December corn futures.
Twitter: @MarcusLudtke
Author hedges corn futures and may have a position at the time of publication. Any opinions expressed herein are solely those of the author, and do not in any way represent the views or opinions of any other person or entity.
Data References:
- USDA United States Department of Ag
- EIA Energy Information Association
- NASS National Agricultural Statistics Service


