March corn futures closed down 6 cents last week, continuing a trend of ho-hum trading.
With year-end in sight, corn traders are beginning to look ahead. Let’s review key news and trends in the market as we approach the new year.
It was an extremely quiet week in corn and soybeans with the market transitioning to “holiday” mode with Christmas and New Year’s right around the corner.
Monday’s Weekly Export Inspections report showed U.S. corn inspections of 34.8 million bushels for the week ending December 13th, 2018. Crop year-to-day corn shipments for 2018/19 improved to 629.6 million bushels, up 73% from a year ago.
Meanwhile weekly U.S. soybean inspections totaled 35.8 million bushel, resulting in 2018/19 soybean shipments increasing to 557 million bushels, down 41% from the previous crop year.
On Wednesday (12/19), the USDA reported U.S. soybean export sales of 1.199 MMT to China for 2018/19. Those sales on top of the purchases China made last Thursday and Friday have pushed China’s collective 2-week U.S. soybean buys up to nearly 2.8 MMT.
As I mentioned last week, the market thus far has responded very unenthusiastically to China re-entering the U.S. soybean market with traders still seemingly disappointed with the actual sales volumes. The expectation was and remains that China will be in for at least 5 MMT of U.S. soybeans (possibly 8 MMT). Therefore the current sales total, while a notable improvement since Trump met with China’s President Xi Jinping at the G-20 summit earlier this month, hasn’t been enough to encourage new soybean longs above key price resistance in March soybean futures (i.e. the day high in SH19 of $9.41 on 12/12).
It should also be noted that several traders still believe China’s recent purchases are nothing more than token buys in an attempt to restore some semblance of China “doing their part” to help end the tariff stand-off between the PRC and the United States.
Thursday’s Export Sales report showed U.S. corn export sales of 77.7 million bushels for the week ending 12/13/2018.
Crop year-to-date corn export sales for 2018/19 improved to 1.166 billion bushels, up 17% from a year ago. Despite the accelerated sales and inspections pace I still expect the USDA to hold its current 2018/19 U.S. corn export forecast of 2.450 billion bushels steady until more is known about the size and production potential of Brazil’s safrinha corn crop. Last week Conab estimated total 2018/19 Brazil corn production at 91.1 MMT, up 12.8% from the prior year. This compares to the USDA’s December forecast of 94.5 MMT.
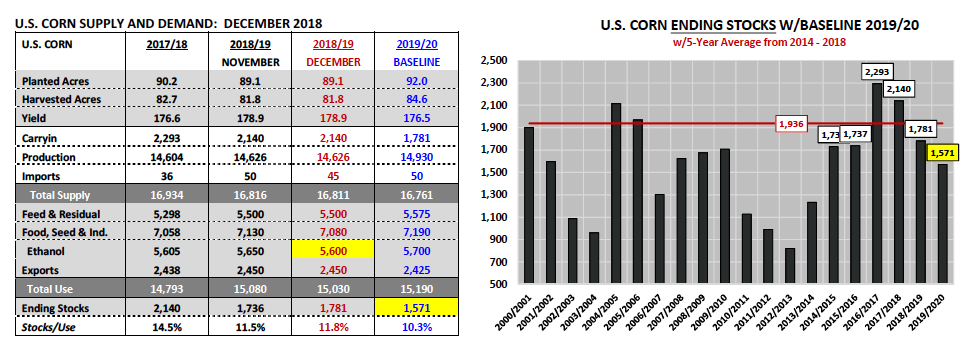
However, it should be noted that in either case approximately 65 to 70% of that total will be made up of safrinha corn, which won’t even be planted until Jan/Feb 2019. Therefore the perceived increase in 2018/19 Brazilian corn production is still very much far from guaranteed. That said if Brazil’s safrinha corn production does return to trend in 2018/19, Brazilian corn exports will likely start to displace U.S. corn exports beginning in June/Jul/Aug 2019.
CORN FUTURES TRADING OUTLOOK:
Corn and soybean futures faded late in the week with a possible partial U.S. government shutdown weighing on both commodity and equity markets. I’m also of the opinion that the U.S. Federal Reserve’s recent decision to raise the federal funds rate 25 basis points in its December meeting (the 4th increase this year) was also a contributing factor to the downward slide in commodity values.
For example on Friday, Spot Crude Oil futures (QCL2019G) fell to their lowest level since July 2017, making a day low of $45.13 per barrel (Crude Oil’s calendar year day high was $76.90 on 10/3/18 in QCL2018X). Therefore the Marco-markets invariably played a significant role in this week’s negative price action across all commodity sectors.
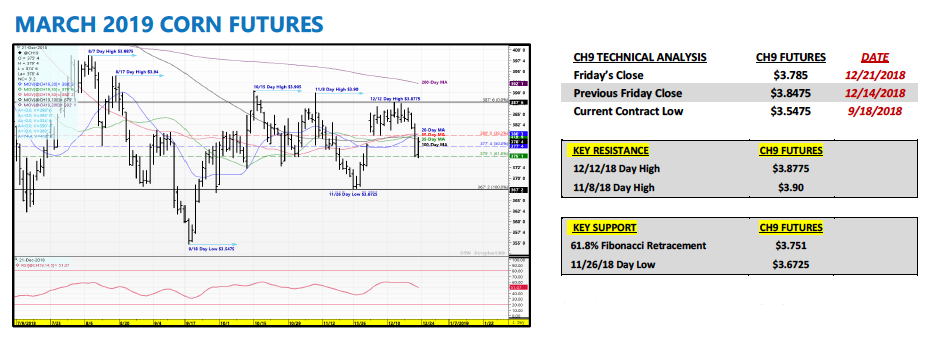
Technically March corn futures had been consolidating for some time, trading within approximately an 8-cents per bushel, low-to-high range ($3.80 to $3.87 ¾) from 12/3 – 12/19.
However on Thursday afternoon a breakout move lower unfolded with CH19 closing down 6 ½-cents per bushel; failing to hold key price support at the 100-day moving of $3.791. Thursday’s losses were eventually pared on Friday; however it wasn’t nearly enough to prevent continued speculation that additional cash-outflows from Money Managers could be in the offing over the next 1 to 2 weeks.
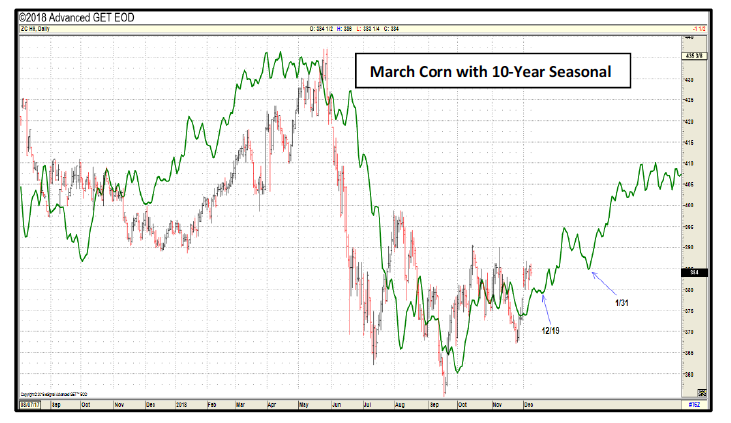
Seasonality:
Friday’s Commitment of Traders report showed the Managed Money long in corn increasing nearly +30k contracts week-on-week to a net long of +128,177 contracts.
Those figures were as of the market closes on Tuesday (12/18). Therefore they did not take into account the selling pressure late in the week, which was likely a byproduct of some Managed Money longs getting out of their positions. That said I’ll be very interested to see what the market reaction is next week with traders having a full weekend to digest the evolving uncertainties in D.C. I’m assuming we’ll have some answers on whether or not the shutdown was averted by Monday (12/24). That said “risk aversion” and position squaring tends to be the mentality for most when it comes to navigating the major Macro-market elements currently in play, which will have a tremendous ripple effect on a host of commodities values.
Twitter: @MarcusLudtke
Author hedges corn futures and may have a position at the time of publication. Any opinions expressed herein are solely those of the author, and do not in any way represent the views or opinions of any other person or entity.
Data References:
- USDA United States Department of Ag
- EIA Energy Information Association
- NASS National Agricultural Statistics Service

: Worrisome to Broader Market?")


