After our Elliott wave forecasts for the S&P 500 and the Russell 2000 ETFs, we wanted to cover one of the indices that has been relatively more bullish during 2023. This post offers two scenarios for the NASDAQ 100 Index. Both cases are net bearish going into mid-2024, but one of them could allow a near-term rally during the final months of 2023.
Examining the price action since the 2021 high becomes an exercise in counting corrective structures. Of the counts that are technically viable, we have selected the two that appear most probable.
Our preferred scenario is shown with the black labels and gray path while our alternative near-term bullish scenario is shown in green.
The big-picture pattern we recommend tracking is an [a]-[b]-[c] structure that started at the 2021 high. Middle wave [b] is either already complete (gray path) or on the verge of completion with another high (green path). When [b] is finished, a strong downward wave [c] should follow that could retest the basic area of the 2022 low.
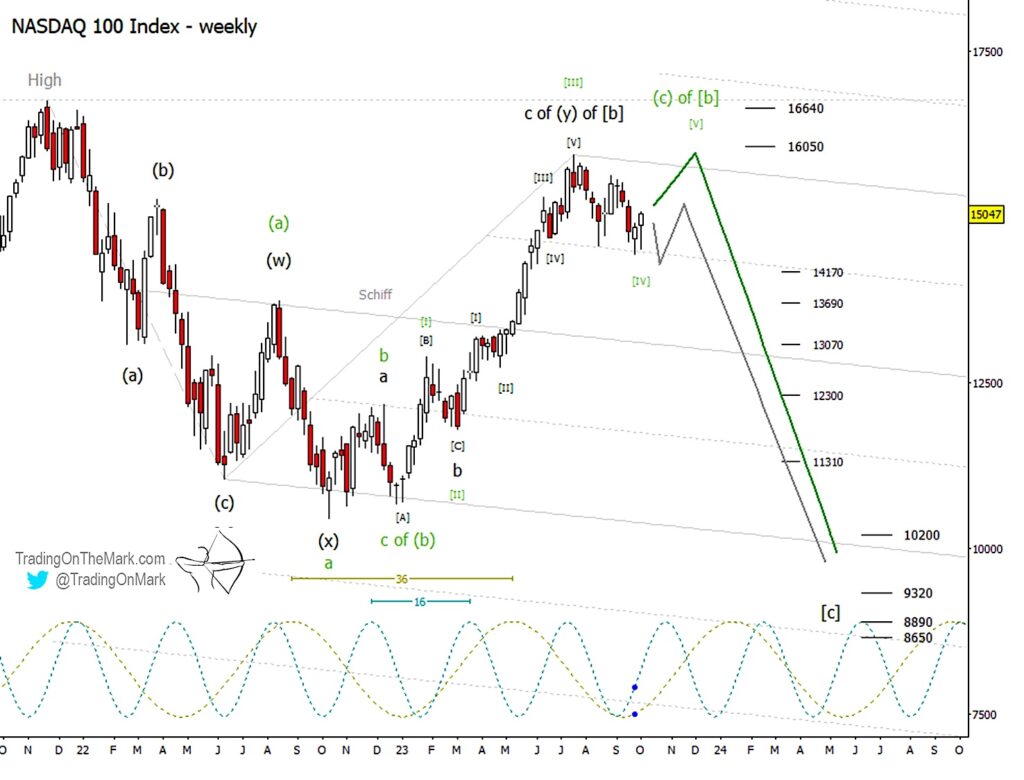
The index’s behavior during the next one or two weeks might provide a clue about whether large wave [b] is finished or not. A minor lower low in October could constitute a leading diagonal start of downward wave [c], which would mean the [b] wave high is already finished.
Alternatively the absence of a lower low in October could foretell a rally from the current area into November and possibly December to complete the final leg of [b]. If the market elects to follow the near-term bullish path, major resistance awaits near 16050 and 16640.
The big-picture support targets for downward wave [c] apply to both scenarios. The relatively more conservative support at 10200 represents a 1×1 relationship between waves [a] and [c], and it aligns fairly well with the lower boundary of the preliminary Schiff channel we have drawn. The next set of supports at 9320, 8890, and 8650 were derived from a variety of Fibonacci-related methods.
The middle set of supports is also relevant to either of the two scenarios, and nimble traders might play for a set of cascading moves downward through the levels. In particular, 14170 would be a reasonable place for a minor lower low to set during October if the market is following the gray path.
As for timing, the faster 16-week cycle might allow for a higher high in early November if the index is following the green path. (Timing is tricky, so be mindful that there’s considerable leeway about when such a high could occur. We think it would happen before the year’s end in the alternative scenario.) An approximate target for a wave [c] low in both scenarios would be late May or early June 2024 based on the 36-week cycle.
Trading On The Mark uses technical analysis to identify the trends and turns in highly traded markets for commodities, energy, currency, bonds and indices. Visit their website for more charts, and follow Trading On The Mark for updates and special offers.
Twitter: @TradingOnMark
The authors may have a position in the mentioned securities at the time of publication. Any opinions expressed herein are solely those of the author, and do not in any way represent the views or opinions of any other person or entity.


